Lithuanian vs Immigrants from Syria Self-Care Disability
COMPARE
Lithuanian
Immigrants from Syria
Self-Care Disability
Self-Care Disability Comparison
Lithuanians
Immigrants from Syria
2.4%
SELF-CARE DISABILITY
98.0/ 100
METRIC RATING
88th/ 347
METRIC RANK
2.6%
SELF-CARE DISABILITY
1.0/ 100
METRIC RATING
241st/ 347
METRIC RANK
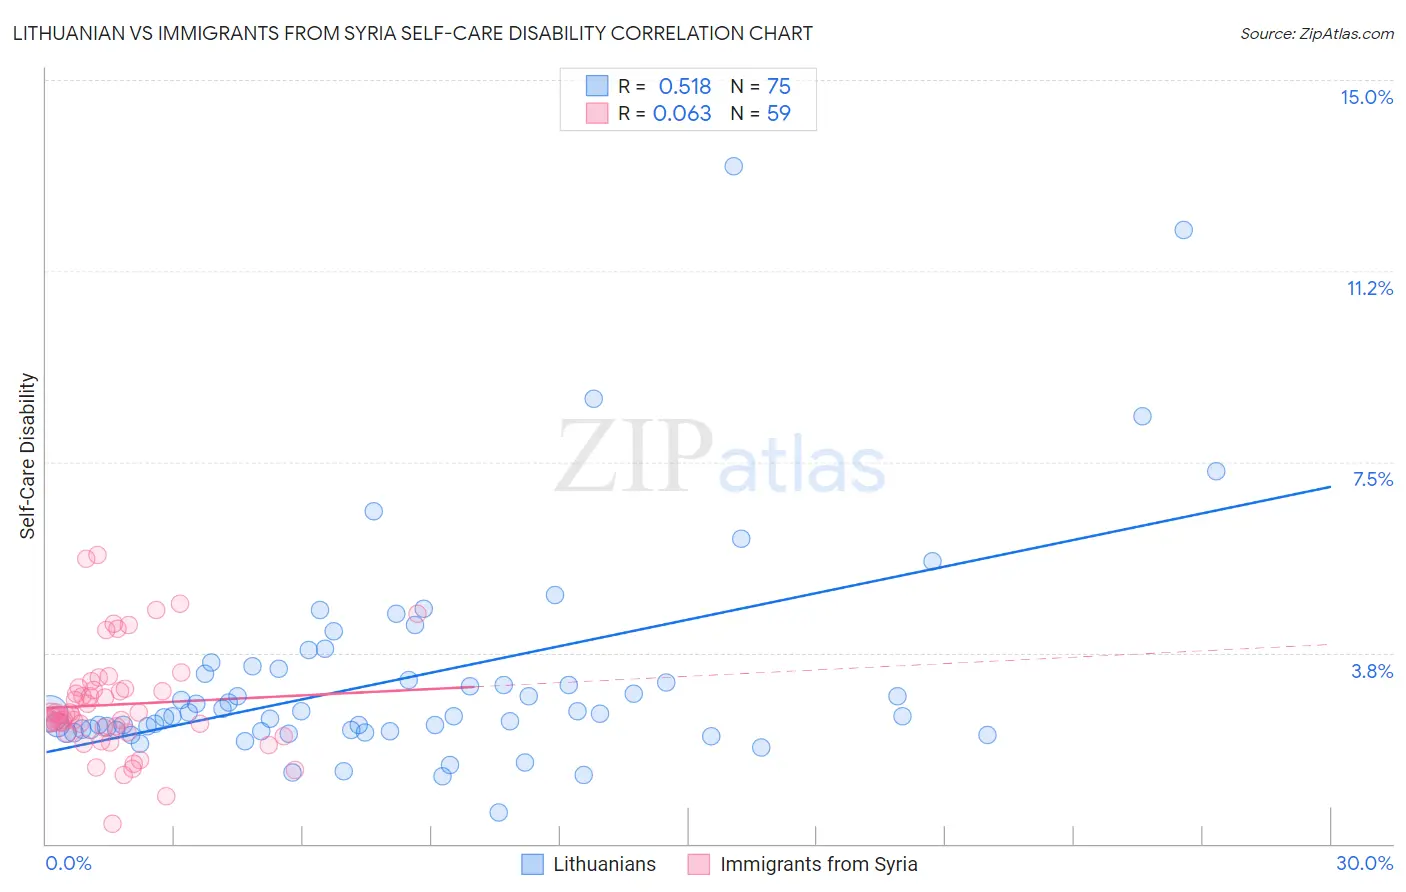
Lithuanian vs Immigrants from Syria Self-Care Disability Correlation Chart
The statistical analysis conducted on geographies consisting of 421,348,071 people shows a substantial positive correlation between the proportion of Lithuanians and percentage of population with self-care disability in the United States with a correlation coefficient (R) of 0.518 and weighted average of 2.4%. Similarly, the statistical analysis conducted on geographies consisting of 174,100,032 people shows a slight positive correlation between the proportion of Immigrants from Syria and percentage of population with self-care disability in the United States with a correlation coefficient (R) of 0.063 and weighted average of 2.6%, a difference of 10.6%.
Self-Care Disability Correlation Summary
| Measurement | Lithuanian | Immigrants from Syria |
| Minimum | 0.63% | 0.40% |
| Maximum | 13.3% | 5.7% |
| Range | 12.7% | 5.3% |
| Mean | 3.3% | 2.7% |
| Median | 2.6% | 2.5% |
| Interquartile 25% (IQ1) | 2.2% | 2.2% |
| Interquartile 75% (IQ3) | 3.4% | 3.1% |
| Interquartile Range (IQR) | 1.2% | 0.86% |
| Standard Deviation (Sample) | 2.2% | 1.0% |
| Standard Deviation (Population) | 2.1% | 1.0% |
Similar Demographics by Self-Care Disability
Demographics Similar to Lithuanians by Self-Care Disability
In terms of self-care disability, the demographic groups most similar to Lithuanians are Sierra Leonean (2.4%, a difference of 0.0%), Immigrants from Congo (2.4%, a difference of 0.050%), Immigrants from Northern Africa (2.3%, a difference of 0.14%), Estonian (2.3%, a difference of 0.16%), and Immigrants from Czechoslovakia (2.4%, a difference of 0.19%).
| Demographics | Rating | Rank | Self-Care Disability |
| Ugandans | 98.8 /100 | #81 | Exceptional 2.3% |
| Immigrants | Denmark | 98.8 /100 | #82 | Exceptional 2.3% |
| Indians (Asian) | 98.7 /100 | #83 | Exceptional 2.3% |
| Immigrants | Spain | 98.7 /100 | #84 | Exceptional 2.3% |
| Estonians | 98.3 /100 | #85 | Exceptional 2.3% |
| Immigrants | Northern Africa | 98.2 /100 | #86 | Exceptional 2.3% |
| Sierra Leoneans | 98.0 /100 | #87 | Exceptional 2.4% |
| Lithuanians | 98.0 /100 | #88 | Exceptional 2.4% |
| Immigrants | Congo | 98.0 /100 | #89 | Exceptional 2.4% |
| Immigrants | Czechoslovakia | 97.7 /100 | #90 | Exceptional 2.4% |
| Immigrants | Jordan | 97.7 /100 | #91 | Exceptional 2.4% |
| Icelanders | 97.4 /100 | #92 | Exceptional 2.4% |
| Immigrants | Latvia | 97.0 /100 | #93 | Exceptional 2.4% |
| Macedonians | 96.9 /100 | #94 | Exceptional 2.4% |
| Immigrants | Asia | 96.9 /100 | #95 | Exceptional 2.4% |
Demographics Similar to Immigrants from Syria by Self-Care Disability
In terms of self-care disability, the demographic groups most similar to Immigrants from Syria are Marshallese (2.6%, a difference of 0.17%), Immigrants from Panama (2.6%, a difference of 0.20%), Spanish (2.6%, a difference of 0.23%), Senegalese (2.6%, a difference of 0.24%), and Hawaiian (2.6%, a difference of 0.31%).
| Demographics | Rating | Rank | Self-Care Disability |
| Vietnamese | 2.1 /100 | #234 | Tragic 2.6% |
| Bahamians | 2.0 /100 | #235 | Tragic 2.6% |
| Bermudans | 1.9 /100 | #236 | Tragic 2.6% |
| Immigrants | Senegal | 1.6 /100 | #237 | Tragic 2.6% |
| Senegalese | 1.3 /100 | #238 | Tragic 2.6% |
| Immigrants | Panama | 1.2 /100 | #239 | Tragic 2.6% |
| Marshallese | 1.2 /100 | #240 | Tragic 2.6% |
| Immigrants | Syria | 1.0 /100 | #241 | Tragic 2.6% |
| Spanish | 0.8 /100 | #242 | Tragic 2.6% |
| Hawaiians | 0.8 /100 | #243 | Tragic 2.6% |
| Yuman | 0.8 /100 | #244 | Tragic 2.6% |
| Immigrants | Western Asia | 0.6 /100 | #245 | Tragic 2.6% |
| Cheyenne | 0.6 /100 | #246 | Tragic 2.6% |
| Immigrants | Albania | 0.6 /100 | #247 | Tragic 2.6% |
| Nicaraguans | 0.6 /100 | #248 | Tragic 2.6% |