Canadian vs Mongolian Self-Care Disability
COMPARE
Canadian
Mongolian
Self-Care Disability
Self-Care Disability Comparison
Canadians
Mongolians
2.5%
SELF-CARE DISABILITY
58.8/ 100
METRIC RATING
166th/ 347
METRIC RANK
2.3%
SELF-CARE DISABILITY
99.3/ 100
METRIC RATING
63rd/ 347
METRIC RANK
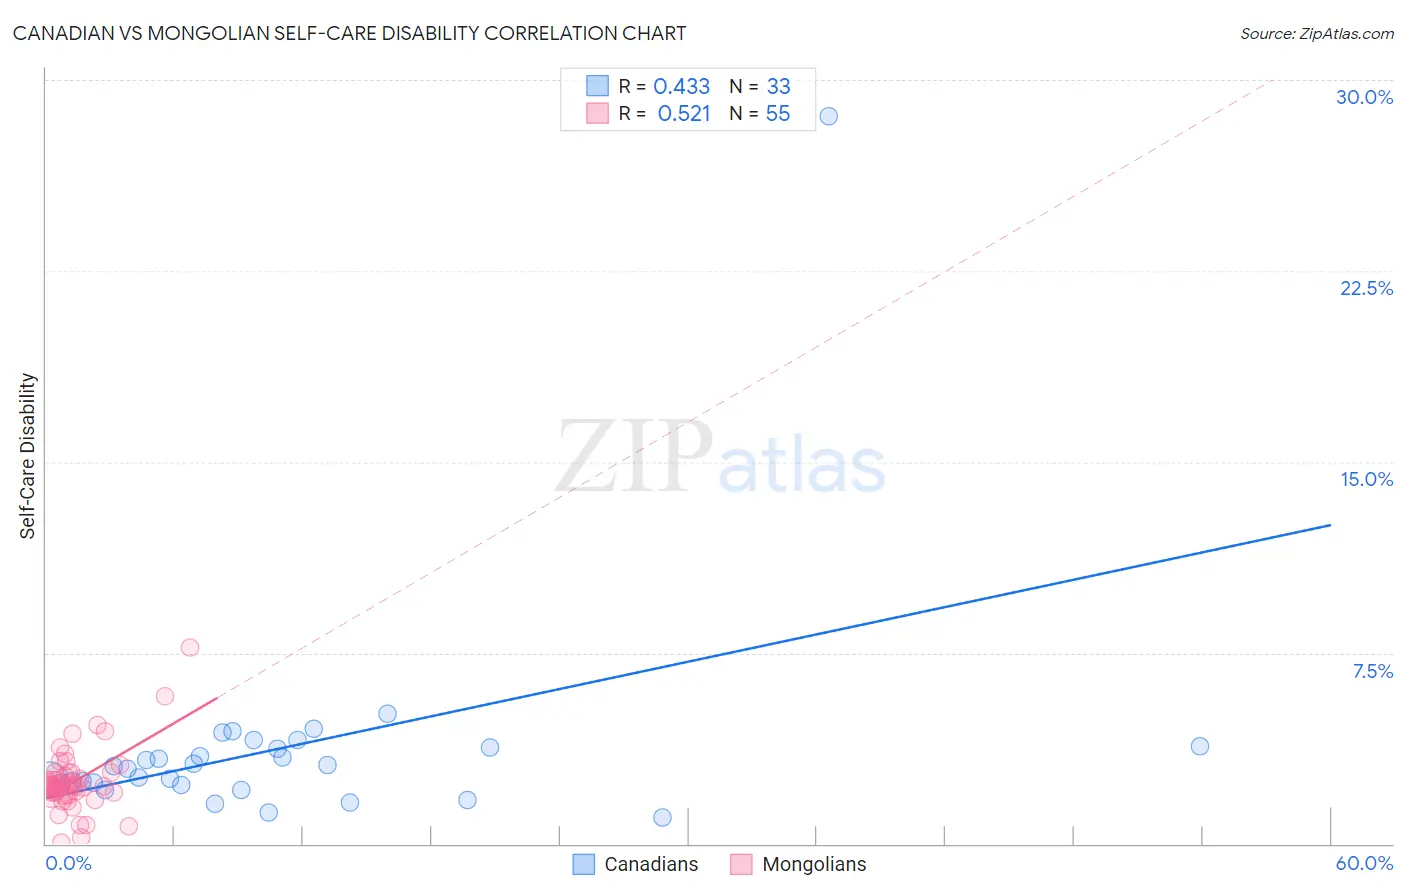
Canadian vs Mongolian Self-Care Disability Correlation Chart
The statistical analysis conducted on geographies consisting of 436,894,568 people shows a moderate positive correlation between the proportion of Canadians and percentage of population with self-care disability in the United States with a correlation coefficient (R) of 0.433 and weighted average of 2.5%. Similarly, the statistical analysis conducted on geographies consisting of 140,258,079 people shows a substantial positive correlation between the proportion of Mongolians and percentage of population with self-care disability in the United States with a correlation coefficient (R) of 0.521 and weighted average of 2.3%, a difference of 5.9%.
Self-Care Disability Correlation Summary
| Measurement | Canadian | Mongolian |
| Minimum | 1.1% | 0.065% |
| Maximum | 28.6% | 7.7% |
| Range | 27.5% | 7.6% |
| Mean | 3.7% | 2.4% |
| Median | 3.0% | 2.2% |
| Interquartile 25% (IQ1) | 2.3% | 1.9% |
| Interquartile 75% (IQ3) | 3.8% | 2.8% |
| Interquartile Range (IQR) | 1.5% | 0.86% |
| Standard Deviation (Sample) | 4.6% | 1.2% |
| Standard Deviation (Population) | 4.5% | 1.2% |
Similar Demographics by Self-Care Disability
Demographics Similar to Canadians by Self-Care Disability
In terms of self-care disability, the demographic groups most similar to Canadians are Syrian (2.5%, a difference of 0.010%), Immigrants from Vietnam (2.5%, a difference of 0.030%), Immigrants from Greece (2.5%, a difference of 0.070%), Ute (2.5%, a difference of 0.080%), and Immigrants from Somalia (2.5%, a difference of 0.14%).
| Demographics | Rating | Rank | Self-Care Disability |
| Immigrants | Italy | 68.5 /100 | #159 | Good 2.4% |
| Finns | 67.0 /100 | #160 | Good 2.4% |
| Lebanese | 66.5 /100 | #161 | Good 2.4% |
| Somalis | 63.7 /100 | #162 | Good 2.5% |
| German Russians | 62.7 /100 | #163 | Good 2.5% |
| Immigrants | Vietnam | 59.3 /100 | #164 | Average 2.5% |
| Syrians | 59.0 /100 | #165 | Average 2.5% |
| Canadians | 58.8 /100 | #166 | Average 2.5% |
| Immigrants | Greece | 57.3 /100 | #167 | Average 2.5% |
| Ute | 57.1 /100 | #168 | Average 2.5% |
| Immigrants | Somalia | 55.9 /100 | #169 | Average 2.5% |
| Scottish | 54.3 /100 | #170 | Average 2.5% |
| Pennsylvania Germans | 53.5 /100 | #171 | Average 2.5% |
| Czechoslovakians | 53.5 /100 | #172 | Average 2.5% |
| Immigrants | Burma/Myanmar | 52.8 /100 | #173 | Average 2.5% |
Demographics Similar to Mongolians by Self-Care Disability
In terms of self-care disability, the demographic groups most similar to Mongolians are Swedish (2.3%, a difference of 0.010%), Brazilian (2.3%, a difference of 0.070%), Egyptian (2.3%, a difference of 0.090%), Immigrants from Argentina (2.3%, a difference of 0.10%), and South African (2.3%, a difference of 0.13%).
| Demographics | Rating | Rank | Self-Care Disability |
| Immigrants | Eastern Asia | 99.6 /100 | #56 | Exceptional 2.3% |
| Immigrants | Belgium | 99.6 /100 | #57 | Exceptional 2.3% |
| Immigrants | Cameroon | 99.6 /100 | #58 | Exceptional 2.3% |
| New Zealanders | 99.5 /100 | #59 | Exceptional 2.3% |
| Immigrants | Japan | 99.5 /100 | #60 | Exceptional 2.3% |
| Palestinians | 99.4 /100 | #61 | Exceptional 2.3% |
| Egyptians | 99.4 /100 | #62 | Exceptional 2.3% |
| Mongolians | 99.3 /100 | #63 | Exceptional 2.3% |
| Swedes | 99.3 /100 | #64 | Exceptional 2.3% |
| Brazilians | 99.3 /100 | #65 | Exceptional 2.3% |
| Immigrants | Argentina | 99.3 /100 | #66 | Exceptional 2.3% |
| South Africans | 99.3 /100 | #67 | Exceptional 2.3% |
| Immigrants | Zaire | 99.2 /100 | #68 | Exceptional 2.3% |
| Immigrants | Norway | 99.2 /100 | #69 | Exceptional 2.3% |
| Immigrants | Northern Europe | 99.2 /100 | #70 | Exceptional 2.3% |