Lithuanian vs Immigrants from Eastern Africa Self-Care Disability
COMPARE
Lithuanian
Immigrants from Eastern Africa
Self-Care Disability
Self-Care Disability Comparison
Lithuanians
Immigrants from Eastern Africa
2.4%
SELF-CARE DISABILITY
98.0/ 100
METRIC RATING
88th/ 347
METRIC RANK
2.3%
SELF-CARE DISABILITY
99.9/ 100
METRIC RATING
38th/ 347
METRIC RANK
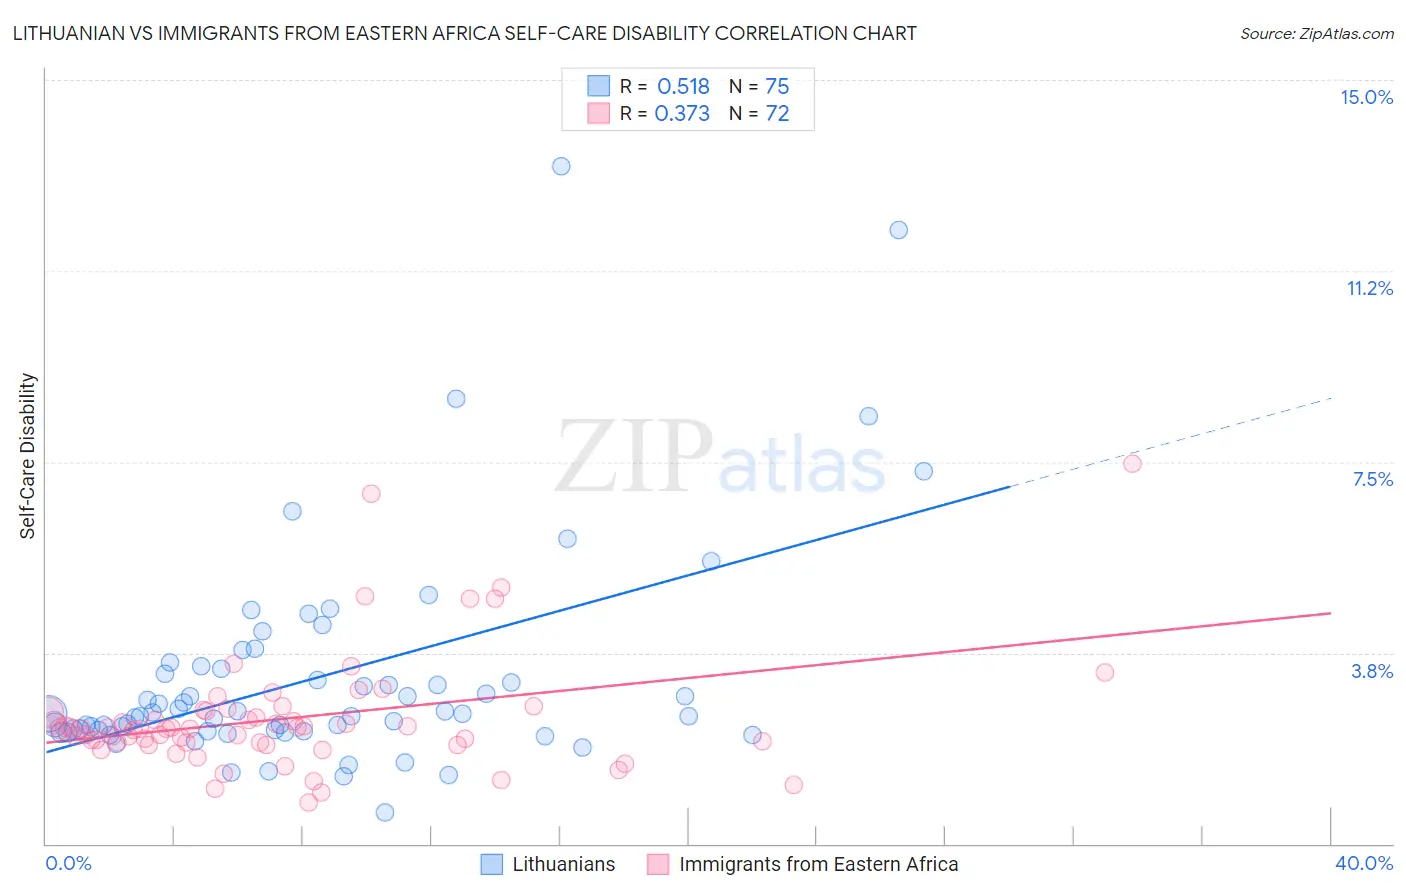
Lithuanian vs Immigrants from Eastern Africa Self-Care Disability Correlation Chart
The statistical analysis conducted on geographies consisting of 421,348,071 people shows a substantial positive correlation between the proportion of Lithuanians and percentage of population with self-care disability in the United States with a correlation coefficient (R) of 0.518 and weighted average of 2.4%. Similarly, the statistical analysis conducted on geographies consisting of 354,752,249 people shows a mild positive correlation between the proportion of Immigrants from Eastern Africa and percentage of population with self-care disability in the United States with a correlation coefficient (R) of 0.373 and weighted average of 2.3%, a difference of 3.4%.
Self-Care Disability Correlation Summary
| Measurement | Lithuanian | Immigrants from Eastern Africa |
| Minimum | 0.63% | 0.81% |
| Maximum | 13.3% | 7.5% |
| Range | 12.7% | 6.7% |
| Mean | 3.3% | 2.5% |
| Median | 2.6% | 2.3% |
| Interquartile 25% (IQ1) | 2.2% | 2.0% |
| Interquartile 75% (IQ3) | 3.4% | 2.6% |
| Interquartile Range (IQR) | 1.2% | 0.61% |
| Standard Deviation (Sample) | 2.2% | 1.1% |
| Standard Deviation (Population) | 2.1% | 1.1% |
Similar Demographics by Self-Care Disability
Demographics Similar to Lithuanians by Self-Care Disability
In terms of self-care disability, the demographic groups most similar to Lithuanians are Sierra Leonean (2.4%, a difference of 0.0%), Immigrants from Congo (2.4%, a difference of 0.050%), Immigrants from Northern Africa (2.3%, a difference of 0.14%), Estonian (2.3%, a difference of 0.16%), and Immigrants from Czechoslovakia (2.4%, a difference of 0.19%).
| Demographics | Rating | Rank | Self-Care Disability |
| Ugandans | 98.8 /100 | #81 | Exceptional 2.3% |
| Immigrants | Denmark | 98.8 /100 | #82 | Exceptional 2.3% |
| Indians (Asian) | 98.7 /100 | #83 | Exceptional 2.3% |
| Immigrants | Spain | 98.7 /100 | #84 | Exceptional 2.3% |
| Estonians | 98.3 /100 | #85 | Exceptional 2.3% |
| Immigrants | Northern Africa | 98.2 /100 | #86 | Exceptional 2.3% |
| Sierra Leoneans | 98.0 /100 | #87 | Exceptional 2.4% |
| Lithuanians | 98.0 /100 | #88 | Exceptional 2.4% |
| Immigrants | Congo | 98.0 /100 | #89 | Exceptional 2.4% |
| Immigrants | Czechoslovakia | 97.7 /100 | #90 | Exceptional 2.4% |
| Immigrants | Jordan | 97.7 /100 | #91 | Exceptional 2.4% |
| Icelanders | 97.4 /100 | #92 | Exceptional 2.4% |
| Immigrants | Latvia | 97.0 /100 | #93 | Exceptional 2.4% |
| Macedonians | 96.9 /100 | #94 | Exceptional 2.4% |
| Immigrants | Asia | 96.9 /100 | #95 | Exceptional 2.4% |
Demographics Similar to Immigrants from Eastern Africa by Self-Care Disability
In terms of self-care disability, the demographic groups most similar to Immigrants from Eastern Africa are Immigrants from Bulgaria (2.3%, a difference of 0.10%), Immigrants from Sweden (2.3%, a difference of 0.13%), Iranian (2.3%, a difference of 0.15%), Immigrants from Sudan (2.3%, a difference of 0.22%), and Immigrants from Lithuania (2.3%, a difference of 0.30%).
| Demographics | Rating | Rank | Self-Care Disability |
| Danes | 99.9 /100 | #31 | Exceptional 2.3% |
| Burmese | 99.9 /100 | #32 | Exceptional 2.3% |
| Immigrants | Korea | 99.9 /100 | #33 | Exceptional 2.3% |
| Immigrants | Turkey | 99.9 /100 | #34 | Exceptional 2.3% |
| Immigrants | Australia | 99.9 /100 | #35 | Exceptional 2.3% |
| Immigrants | Lithuania | 99.9 /100 | #36 | Exceptional 2.3% |
| Immigrants | Sweden | 99.9 /100 | #37 | Exceptional 2.3% |
| Immigrants | Eastern Africa | 99.9 /100 | #38 | Exceptional 2.3% |
| Immigrants | Bulgaria | 99.8 /100 | #39 | Exceptional 2.3% |
| Iranians | 99.8 /100 | #40 | Exceptional 2.3% |
| Immigrants | Sudan | 99.8 /100 | #41 | Exceptional 2.3% |
| Immigrants | Uganda | 99.8 /100 | #42 | Exceptional 2.3% |
| Immigrants | Pakistan | 99.8 /100 | #43 | Exceptional 2.3% |
| Immigrants | South Africa | 99.8 /100 | #44 | Exceptional 2.3% |
| Norwegians | 99.8 /100 | #45 | Exceptional 2.3% |