African vs Mongolian Self-Care Disability
COMPARE
African
Mongolian
Self-Care Disability
Self-Care Disability Comparison
Africans
Mongolians
2.7%
SELF-CARE DISABILITY
0.0/ 100
METRIC RATING
289th/ 347
METRIC RANK
2.3%
SELF-CARE DISABILITY
99.3/ 100
METRIC RATING
63rd/ 347
METRIC RANK
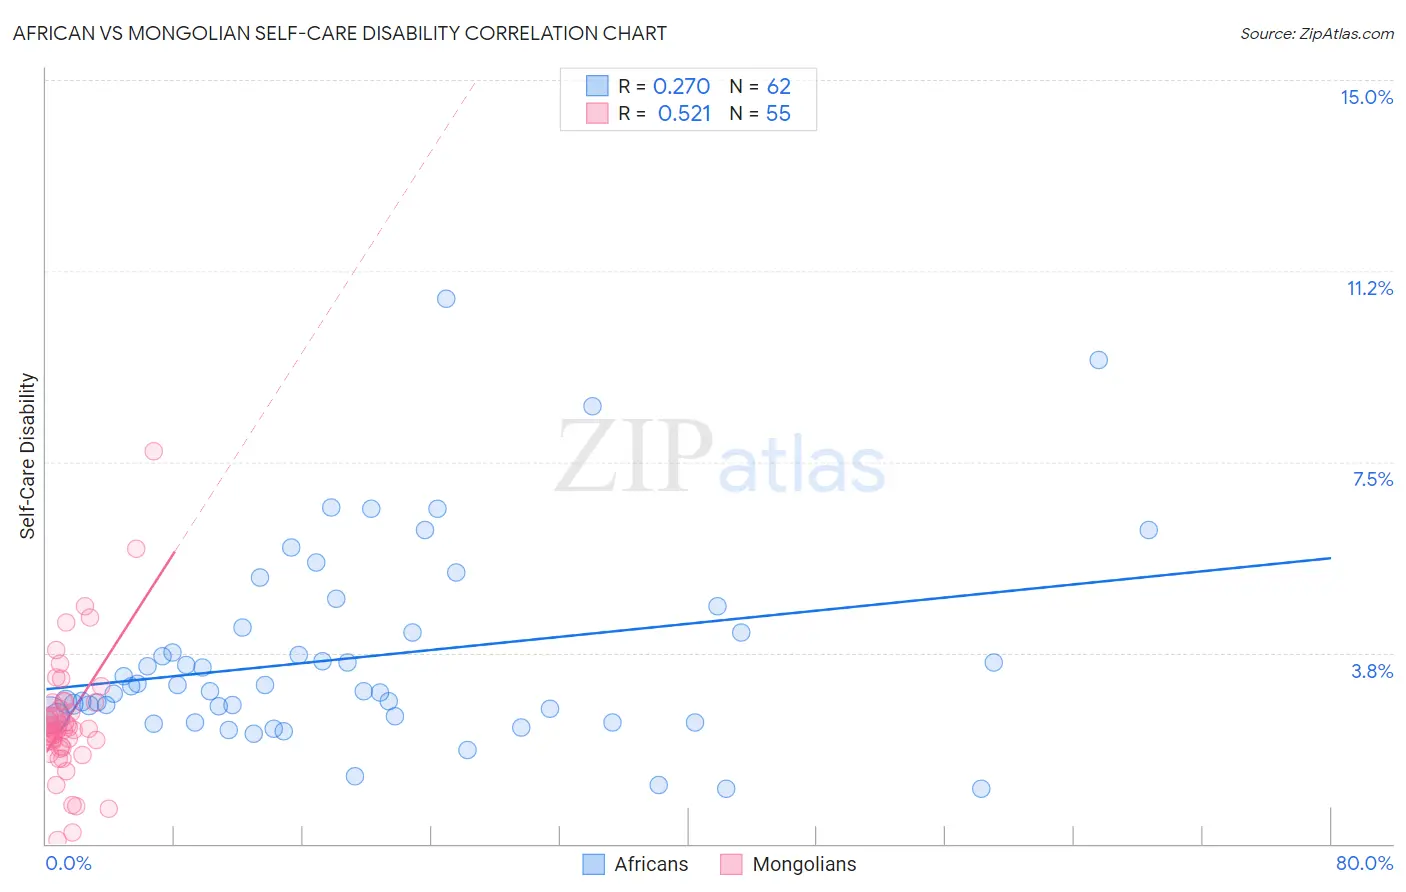
African vs Mongolian Self-Care Disability Correlation Chart
The statistical analysis conducted on geographies consisting of 469,231,301 people shows a weak positive correlation between the proportion of Africans and percentage of population with self-care disability in the United States with a correlation coefficient (R) of 0.270 and weighted average of 2.7%. Similarly, the statistical analysis conducted on geographies consisting of 140,258,079 people shows a substantial positive correlation between the proportion of Mongolians and percentage of population with self-care disability in the United States with a correlation coefficient (R) of 0.521 and weighted average of 2.3%, a difference of 17.6%.
Self-Care Disability Correlation Summary
| Measurement | African | Mongolian |
| Minimum | 1.1% | 0.065% |
| Maximum | 10.7% | 7.7% |
| Range | 9.6% | 7.6% |
| Mean | 3.7% | 2.4% |
| Median | 3.0% | 2.2% |
| Interquartile 25% (IQ1) | 2.5% | 1.9% |
| Interquartile 75% (IQ3) | 4.2% | 2.8% |
| Interquartile Range (IQR) | 1.6% | 0.86% |
| Standard Deviation (Sample) | 1.9% | 1.2% |
| Standard Deviation (Population) | 1.9% | 1.2% |
Similar Demographics by Self-Care Disability
Demographics Similar to Africans by Self-Care Disability
In terms of self-care disability, the demographic groups most similar to Africans are Immigrants from Barbados (2.7%, a difference of 0.10%), Immigrants from Jamaica (2.7%, a difference of 0.14%), Cuban (2.7%, a difference of 0.15%), Guyanese (2.7%, a difference of 0.41%), and French American Indian (2.7%, a difference of 0.47%).
| Demographics | Rating | Rank | Self-Care Disability |
| Apache | 0.0 /100 | #282 | Tragic 2.7% |
| Delaware | 0.0 /100 | #283 | Tragic 2.7% |
| Fijians | 0.0 /100 | #284 | Tragic 2.7% |
| Jamaicans | 0.0 /100 | #285 | Tragic 2.7% |
| French American Indians | 0.0 /100 | #286 | Tragic 2.7% |
| Immigrants | Jamaica | 0.0 /100 | #287 | Tragic 2.7% |
| Immigrants | Barbados | 0.0 /100 | #288 | Tragic 2.7% |
| Africans | 0.0 /100 | #289 | Tragic 2.7% |
| Cubans | 0.0 /100 | #290 | Tragic 2.7% |
| Guyanese | 0.0 /100 | #291 | Tragic 2.7% |
| Central American Indians | 0.0 /100 | #292 | Tragic 2.7% |
| Belizeans | 0.0 /100 | #293 | Tragic 2.7% |
| Blackfeet | 0.0 /100 | #294 | Tragic 2.7% |
| Barbadians | 0.0 /100 | #295 | Tragic 2.7% |
| Immigrants | Portugal | 0.0 /100 | #296 | Tragic 2.8% |
Demographics Similar to Mongolians by Self-Care Disability
In terms of self-care disability, the demographic groups most similar to Mongolians are Swedish (2.3%, a difference of 0.010%), Brazilian (2.3%, a difference of 0.070%), Egyptian (2.3%, a difference of 0.090%), Immigrants from Argentina (2.3%, a difference of 0.10%), and South African (2.3%, a difference of 0.13%).
| Demographics | Rating | Rank | Self-Care Disability |
| Immigrants | Eastern Asia | 99.6 /100 | #56 | Exceptional 2.3% |
| Immigrants | Belgium | 99.6 /100 | #57 | Exceptional 2.3% |
| Immigrants | Cameroon | 99.6 /100 | #58 | Exceptional 2.3% |
| New Zealanders | 99.5 /100 | #59 | Exceptional 2.3% |
| Immigrants | Japan | 99.5 /100 | #60 | Exceptional 2.3% |
| Palestinians | 99.4 /100 | #61 | Exceptional 2.3% |
| Egyptians | 99.4 /100 | #62 | Exceptional 2.3% |
| Mongolians | 99.3 /100 | #63 | Exceptional 2.3% |
| Swedes | 99.3 /100 | #64 | Exceptional 2.3% |
| Brazilians | 99.3 /100 | #65 | Exceptional 2.3% |
| Immigrants | Argentina | 99.3 /100 | #66 | Exceptional 2.3% |
| South Africans | 99.3 /100 | #67 | Exceptional 2.3% |
| Immigrants | Zaire | 99.2 /100 | #68 | Exceptional 2.3% |
| Immigrants | Norway | 99.2 /100 | #69 | Exceptional 2.3% |
| Immigrants | Northern Europe | 99.2 /100 | #70 | Exceptional 2.3% |