Czech vs Mongolian Self-Care Disability
COMPARE
Czech
Mongolian
Self-Care Disability
Self-Care Disability Comparison
Czechs
Mongolians
2.3%
SELF-CARE DISABILITY
99.8/ 100
METRIC RATING
46th/ 347
METRIC RANK
2.3%
SELF-CARE DISABILITY
99.3/ 100
METRIC RATING
63rd/ 347
METRIC RANK
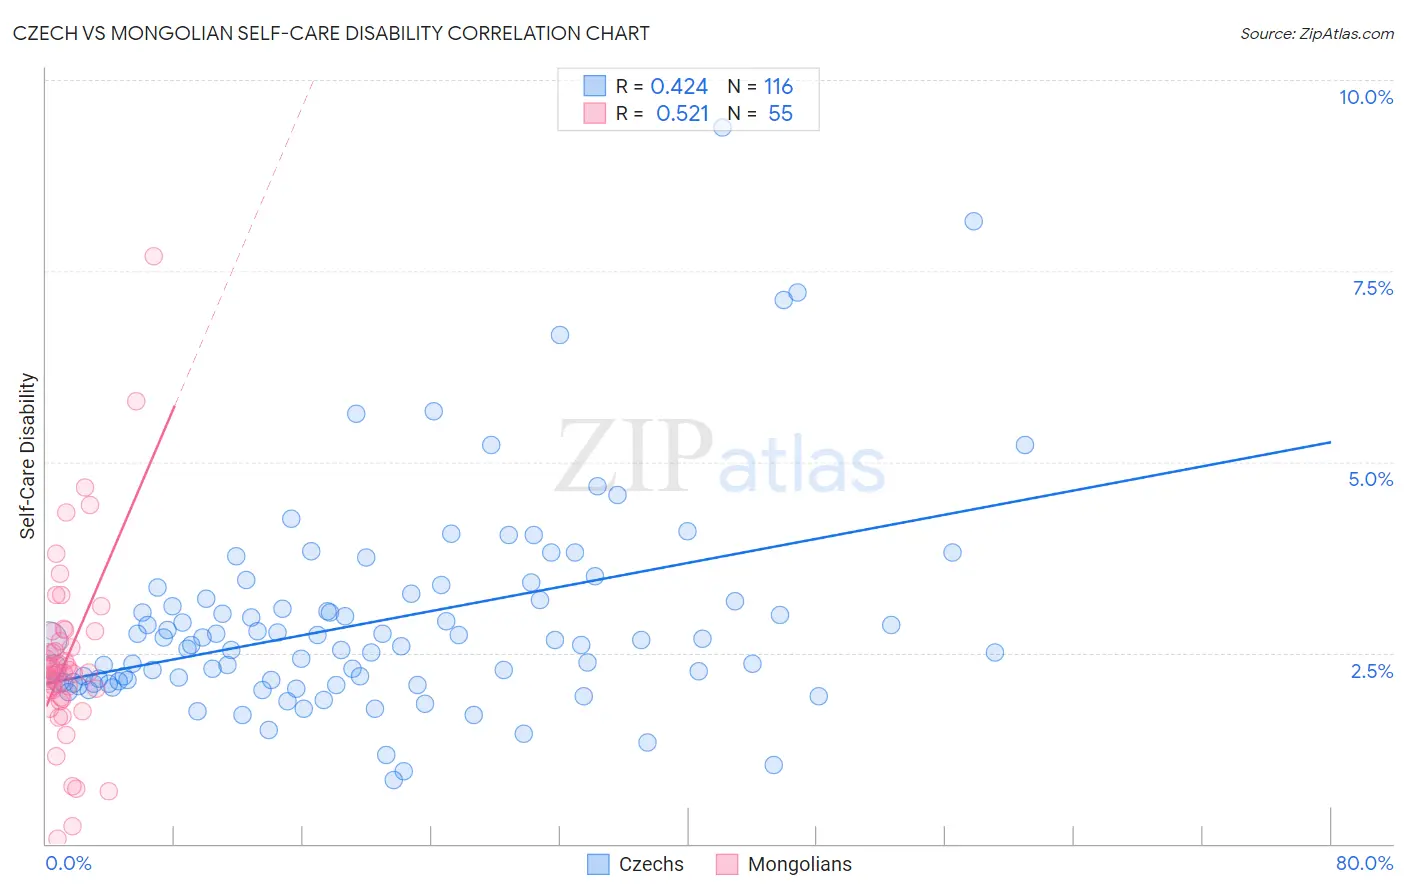
Czech vs Mongolian Self-Care Disability Correlation Chart
The statistical analysis conducted on geographies consisting of 483,678,458 people shows a moderate positive correlation between the proportion of Czechs and percentage of population with self-care disability in the United States with a correlation coefficient (R) of 0.424 and weighted average of 2.3%. Similarly, the statistical analysis conducted on geographies consisting of 140,258,079 people shows a substantial positive correlation between the proportion of Mongolians and percentage of population with self-care disability in the United States with a correlation coefficient (R) of 0.521 and weighted average of 2.3%, a difference of 1.4%.
Self-Care Disability Correlation Summary
| Measurement | Czech | Mongolian |
| Minimum | 0.83% | 0.065% |
| Maximum | 9.4% | 7.7% |
| Range | 8.5% | 7.6% |
| Mean | 2.9% | 2.4% |
| Median | 2.6% | 2.2% |
| Interquartile 25% (IQ1) | 2.1% | 1.9% |
| Interquartile 75% (IQ3) | 3.2% | 2.8% |
| Interquartile Range (IQR) | 1.1% | 0.86% |
| Standard Deviation (Sample) | 1.4% | 1.2% |
| Standard Deviation (Population) | 1.4% | 1.2% |
Demographics Similar to Czechs and Mongolians by Self-Care Disability
In terms of self-care disability, the demographic groups most similar to Czechs are Norwegian (2.3%, a difference of 0.080%), Immigrants from South Africa (2.3%, a difference of 0.13%), Jordanian (2.3%, a difference of 0.23%), Immigrants from Malaysia (2.3%, a difference of 0.27%), and Latvian (2.3%, a difference of 0.45%). Similarly, the demographic groups most similar to Mongolians are Swedish (2.3%, a difference of 0.010%), Egyptian (2.3%, a difference of 0.090%), Palestinian (2.3%, a difference of 0.18%), Immigrants from Japan (2.3%, a difference of 0.27%), and New Zealander (2.3%, a difference of 0.41%).
| Demographics | Rating | Rank | Self-Care Disability |
| Immigrants | South Africa | 99.8 /100 | #44 | Exceptional 2.3% |
| Norwegians | 99.8 /100 | #45 | Exceptional 2.3% |
| Czechs | 99.8 /100 | #46 | Exceptional 2.3% |
| Jordanians | 99.7 /100 | #47 | Exceptional 2.3% |
| Immigrants | Malaysia | 99.7 /100 | #48 | Exceptional 2.3% |
| Latvians | 99.7 /100 | #49 | Exceptional 2.3% |
| Immigrants | Brazil | 99.7 /100 | #50 | Exceptional 2.3% |
| Kenyans | 99.7 /100 | #51 | Exceptional 2.3% |
| Immigrants | Serbia | 99.6 /100 | #52 | Exceptional 2.3% |
| Australians | 99.6 /100 | #53 | Exceptional 2.3% |
| Argentineans | 99.6 /100 | #54 | Exceptional 2.3% |
| Immigrants | France | 99.6 /100 | #55 | Exceptional 2.3% |
| Immigrants | Eastern Asia | 99.6 /100 | #56 | Exceptional 2.3% |
| Immigrants | Belgium | 99.6 /100 | #57 | Exceptional 2.3% |
| Immigrants | Cameroon | 99.6 /100 | #58 | Exceptional 2.3% |
| New Zealanders | 99.5 /100 | #59 | Exceptional 2.3% |
| Immigrants | Japan | 99.5 /100 | #60 | Exceptional 2.3% |
| Palestinians | 99.4 /100 | #61 | Exceptional 2.3% |
| Egyptians | 99.4 /100 | #62 | Exceptional 2.3% |
| Mongolians | 99.3 /100 | #63 | Exceptional 2.3% |
| Swedes | 99.3 /100 | #64 | Exceptional 2.3% |