Lithuanian vs Immigrants from Western Asia Hearing Disability
COMPARE
Lithuanian
Immigrants from Western Asia
Hearing Disability
Hearing Disability Comparison
Lithuanians
Immigrants from Western Asia
3.4%
HEARING DISABILITY
0.6/ 100
METRIC RATING
247th/ 347
METRIC RANK
2.9%
HEARING DISABILITY
86.9/ 100
METRIC RATING
128th/ 347
METRIC RANK
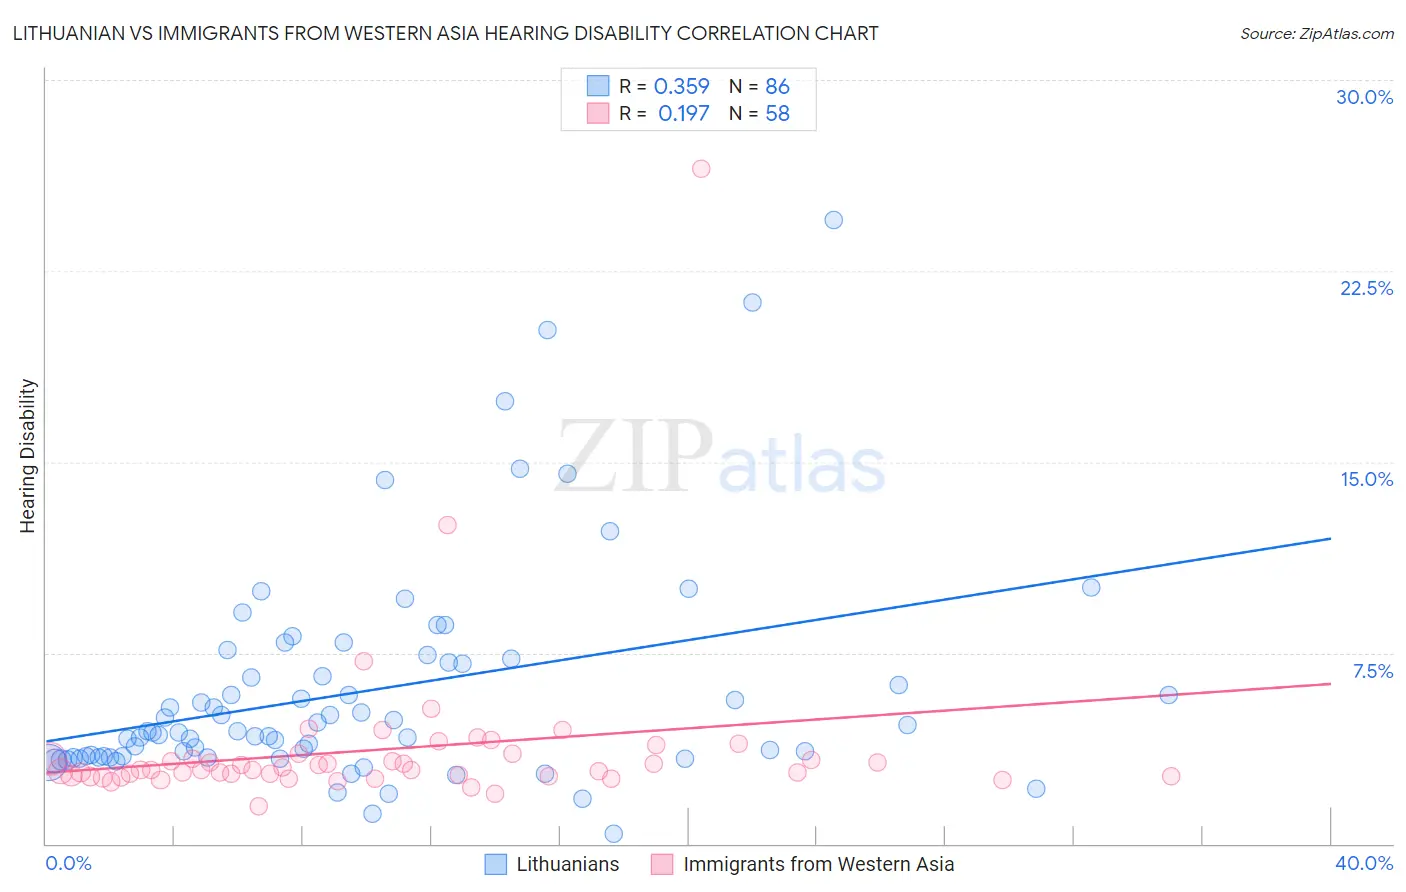
Lithuanian vs Immigrants from Western Asia Hearing Disability Correlation Chart
The statistical analysis conducted on geographies consisting of 421,806,281 people shows a mild positive correlation between the proportion of Lithuanians and percentage of population with hearing disability in the United States with a correlation coefficient (R) of 0.359 and weighted average of 3.4%. Similarly, the statistical analysis conducted on geographies consisting of 404,322,265 people shows a poor positive correlation between the proportion of Immigrants from Western Asia and percentage of population with hearing disability in the United States with a correlation coefficient (R) of 0.197 and weighted average of 2.9%, a difference of 17.1%.
Hearing Disability Correlation Summary
| Measurement | Lithuanian | Immigrants from Western Asia |
| Minimum | 0.40% | 1.5% |
| Maximum | 24.5% | 26.5% |
| Range | 24.1% | 25.0% |
| Mean | 6.0% | 3.7% |
| Median | 4.4% | 2.9% |
| Interquartile 25% (IQ1) | 3.4% | 2.6% |
| Interquartile 75% (IQ3) | 7.1% | 3.4% |
| Interquartile Range (IQR) | 3.7% | 0.72% |
| Standard Deviation (Sample) | 4.4% | 3.4% |
| Standard Deviation (Population) | 4.3% | 3.4% |
Similar Demographics by Hearing Disability
Demographics Similar to Lithuanians by Hearing Disability
In terms of hearing disability, the demographic groups most similar to Lithuanians are Immigrants from England (3.3%, a difference of 0.20%), Austrian (3.4%, a difference of 0.22%), Immigrants from Scotland (3.3%, a difference of 0.48%), Italian (3.4%, a difference of 0.75%), and Yuman (3.4%, a difference of 0.76%).
| Demographics | Rating | Rank | Hearing Disability |
| Immigrants | Netherlands | 1.1 /100 | #240 | Tragic 3.3% |
| Samoans | 1.1 /100 | #241 | Tragic 3.3% |
| Yugoslavians | 1.0 /100 | #242 | Tragic 3.3% |
| Immigrants | Western Europe | 1.0 /100 | #243 | Tragic 3.3% |
| Assyrians/Chaldeans/Syriacs | 0.9 /100 | #244 | Tragic 3.3% |
| Immigrants | Scotland | 0.8 /100 | #245 | Tragic 3.3% |
| Immigrants | England | 0.7 /100 | #246 | Tragic 3.3% |
| Lithuanians | 0.6 /100 | #247 | Tragic 3.4% |
| Austrians | 0.6 /100 | #248 | Tragic 3.4% |
| Italians | 0.4 /100 | #249 | Tragic 3.4% |
| Yuman | 0.4 /100 | #250 | Tragic 3.4% |
| Hungarians | 0.4 /100 | #251 | Tragic 3.4% |
| Croatians | 0.4 /100 | #252 | Tragic 3.4% |
| Carpatho Rusyns | 0.3 /100 | #253 | Tragic 3.4% |
| Slavs | 0.2 /100 | #254 | Tragic 3.4% |
Demographics Similar to Immigrants from Western Asia by Hearing Disability
In terms of hearing disability, the demographic groups most similar to Immigrants from Western Asia are South American Indian (2.9%, a difference of 0.0%), Immigrants from Uganda (2.9%, a difference of 0.050%), Immigrants from Vietnam (2.9%, a difference of 0.070%), Immigrants from Kenya (2.9%, a difference of 0.16%), and Chilean (2.9%, a difference of 0.21%).
| Demographics | Rating | Rank | Hearing Disability |
| Cubans | 89.4 /100 | #121 | Excellent 2.8% |
| Liberians | 89.0 /100 | #122 | Excellent 2.8% |
| Immigrants | Zaire | 88.6 /100 | #123 | Excellent 2.9% |
| Bahamians | 88.6 /100 | #124 | Excellent 2.9% |
| Immigrants | Albania | 88.5 /100 | #125 | Excellent 2.9% |
| Immigrants | Sudan | 87.8 /100 | #126 | Excellent 2.9% |
| South American Indians | 86.9 /100 | #127 | Excellent 2.9% |
| Immigrants | Western Asia | 86.9 /100 | #128 | Excellent 2.9% |
| Immigrants | Uganda | 86.6 /100 | #129 | Excellent 2.9% |
| Immigrants | Vietnam | 86.5 /100 | #130 | Excellent 2.9% |
| Immigrants | Kenya | 86.1 /100 | #131 | Excellent 2.9% |
| Chileans | 85.8 /100 | #132 | Excellent 2.9% |
| Immigrants | Syria | 85.8 /100 | #133 | Excellent 2.9% |
| Ugandans | 85.5 /100 | #134 | Excellent 2.9% |
| Soviet Union | 84.8 /100 | #135 | Excellent 2.9% |