Lithuanian vs Alaskan Athabascan Vision Disability
COMPARE
Lithuanian
Alaskan Athabascan
Vision Disability
Vision Disability Comparison
Lithuanians
Alaskan Athabascans
2.0%
VISION DISABILITY
97.7/ 100
METRIC RATING
80th/ 347
METRIC RANK
3.1%
VISION DISABILITY
0.0/ 100
METRIC RATING
336th/ 347
METRIC RANK
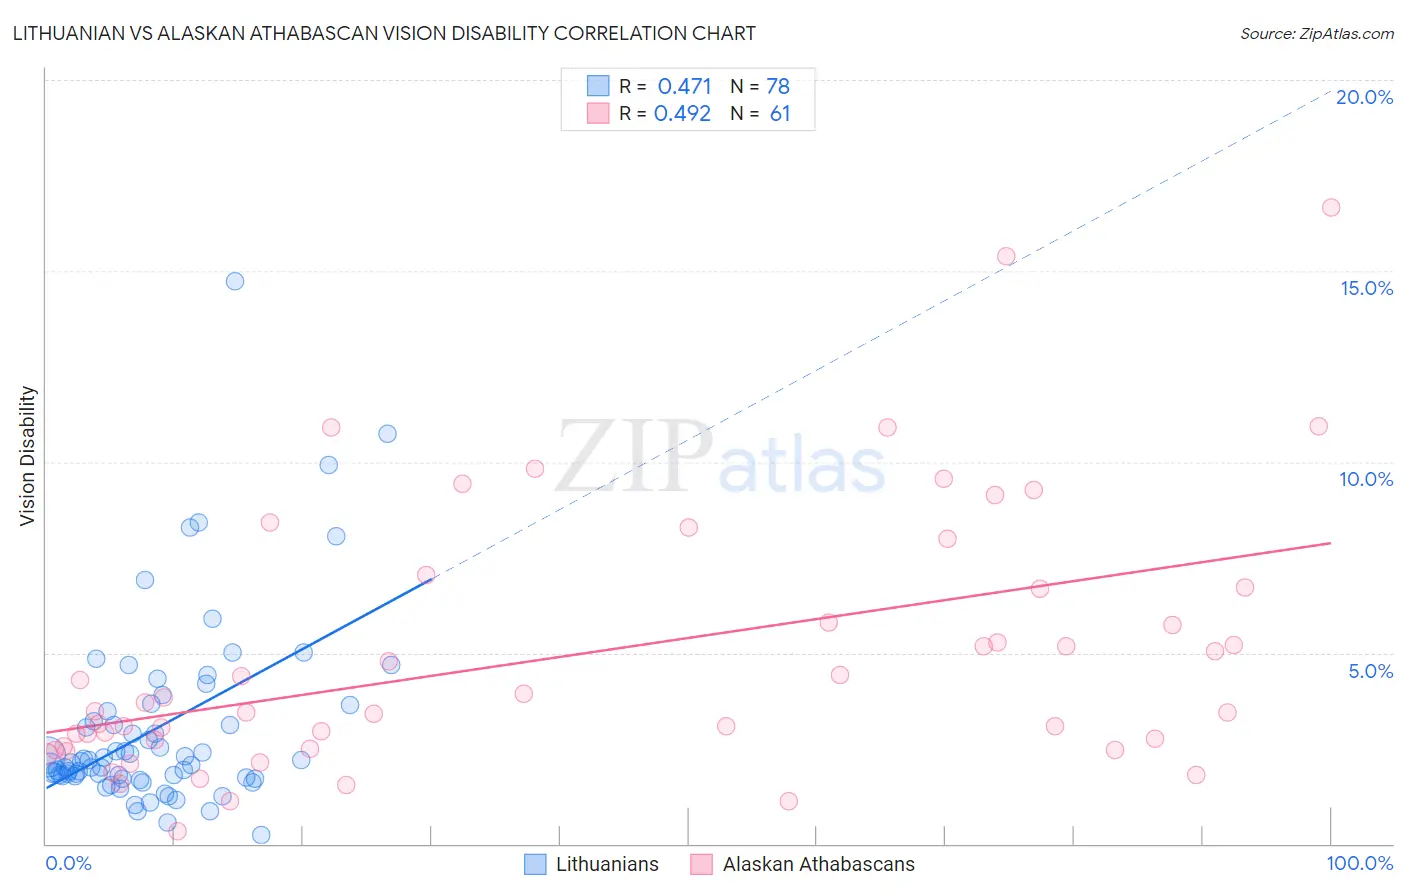
Lithuanian vs Alaskan Athabascan Vision Disability Correlation Chart
The statistical analysis conducted on geographies consisting of 421,489,399 people shows a moderate positive correlation between the proportion of Lithuanians and percentage of population with vision disability in the United States with a correlation coefficient (R) of 0.471 and weighted average of 2.0%. Similarly, the statistical analysis conducted on geographies consisting of 45,813,116 people shows a moderate positive correlation between the proportion of Alaskan Athabascans and percentage of population with vision disability in the United States with a correlation coefficient (R) of 0.492 and weighted average of 3.1%, a difference of 54.5%.
Vision Disability Correlation Summary
| Measurement | Lithuanian | Alaskan Athabascan |
| Minimum | 0.23% | 0.32% |
| Maximum | 14.7% | 16.7% |
| Range | 14.5% | 16.4% |
| Mean | 3.0% | 4.9% |
| Median | 2.2% | 3.5% |
| Interquartile 25% (IQ1) | 1.8% | 2.5% |
| Interquartile 75% (IQ3) | 3.5% | 6.7% |
| Interquartile Range (IQR) | 1.7% | 4.2% |
| Standard Deviation (Sample) | 2.5% | 3.4% |
| Standard Deviation (Population) | 2.4% | 3.4% |
Similar Demographics by Vision Disability
Demographics Similar to Lithuanians by Vision Disability
In terms of vision disability, the demographic groups most similar to Lithuanians are Soviet Union (2.0%, a difference of 0.060%), Immigrants from Poland (2.0%, a difference of 0.090%), Immigrants from Western Asia (2.0%, a difference of 0.17%), Assyrian/Chaldean/Syriac (2.0%, a difference of 0.29%), and Immigrants from Latvia (2.0%, a difference of 0.29%).
| Demographics | Rating | Rank | Vision Disability |
| Immigrants | Eritrea | 98.4 /100 | #73 | Exceptional 2.0% |
| Palestinians | 98.3 /100 | #74 | Exceptional 2.0% |
| Immigrants | North Macedonia | 98.3 /100 | #75 | Exceptional 2.0% |
| Paraguayans | 98.3 /100 | #76 | Exceptional 2.0% |
| Immigrants | Jordan | 98.3 /100 | #77 | Exceptional 2.0% |
| Immigrants | Eastern Europe | 98.3 /100 | #78 | Exceptional 2.0% |
| Assyrians/Chaldeans/Syriacs | 98.1 /100 | #79 | Exceptional 2.0% |
| Lithuanians | 97.7 /100 | #80 | Exceptional 2.0% |
| Soviet Union | 97.6 /100 | #81 | Exceptional 2.0% |
| Immigrants | Poland | 97.6 /100 | #82 | Exceptional 2.0% |
| Immigrants | Western Asia | 97.5 /100 | #83 | Exceptional 2.0% |
| Immigrants | Latvia | 97.3 /100 | #84 | Exceptional 2.0% |
| Chinese | 97.2 /100 | #85 | Exceptional 2.0% |
| Immigrants | Moldova | 97.2 /100 | #86 | Exceptional 2.0% |
| Immigrants | Switzerland | 97.0 /100 | #87 | Exceptional 2.0% |
Demographics Similar to Alaskan Athabascans by Vision Disability
In terms of vision disability, the demographic groups most similar to Alaskan Athabascans are Dutch West Indian (3.2%, a difference of 0.030%), Navajo (3.1%, a difference of 0.16%), Chickasaw (3.2%, a difference of 0.93%), Tsimshian (3.2%, a difference of 1.6%), and Creek (3.2%, a difference of 1.8%).
| Demographics | Rating | Rank | Vision Disability |
| Apache | 0.0 /100 | #329 | Tragic 3.0% |
| Colville | 0.0 /100 | #330 | Tragic 3.0% |
| Central American Indians | 0.0 /100 | #331 | Tragic 3.0% |
| Seminole | 0.0 /100 | #332 | Tragic 3.1% |
| Cajuns | 0.0 /100 | #333 | Tragic 3.1% |
| Cheyenne | 0.0 /100 | #334 | Tragic 3.1% |
| Navajo | 0.0 /100 | #335 | Tragic 3.1% |
| Alaskan Athabascans | 0.0 /100 | #336 | Tragic 3.1% |
| Dutch West Indians | 0.0 /100 | #337 | Tragic 3.2% |
| Chickasaw | 0.0 /100 | #338 | Tragic 3.2% |
| Tsimshian | 0.0 /100 | #339 | Tragic 3.2% |
| Creek | 0.0 /100 | #340 | Tragic 3.2% |
| Kiowa | 0.0 /100 | #341 | Tragic 3.3% |
| Choctaw | 0.0 /100 | #342 | Tragic 3.3% |
| Pima | 0.0 /100 | #343 | Tragic 3.3% |