Lithuanian vs Pakistani Vision Disability
COMPARE
Lithuanian
Pakistani
Vision Disability
Vision Disability Comparison
Lithuanians
Pakistanis
2.0%
VISION DISABILITY
97.7/ 100
METRIC RATING
80th/ 347
METRIC RANK
2.1%
VISION DISABILITY
71.6/ 100
METRIC RATING
156th/ 347
METRIC RANK
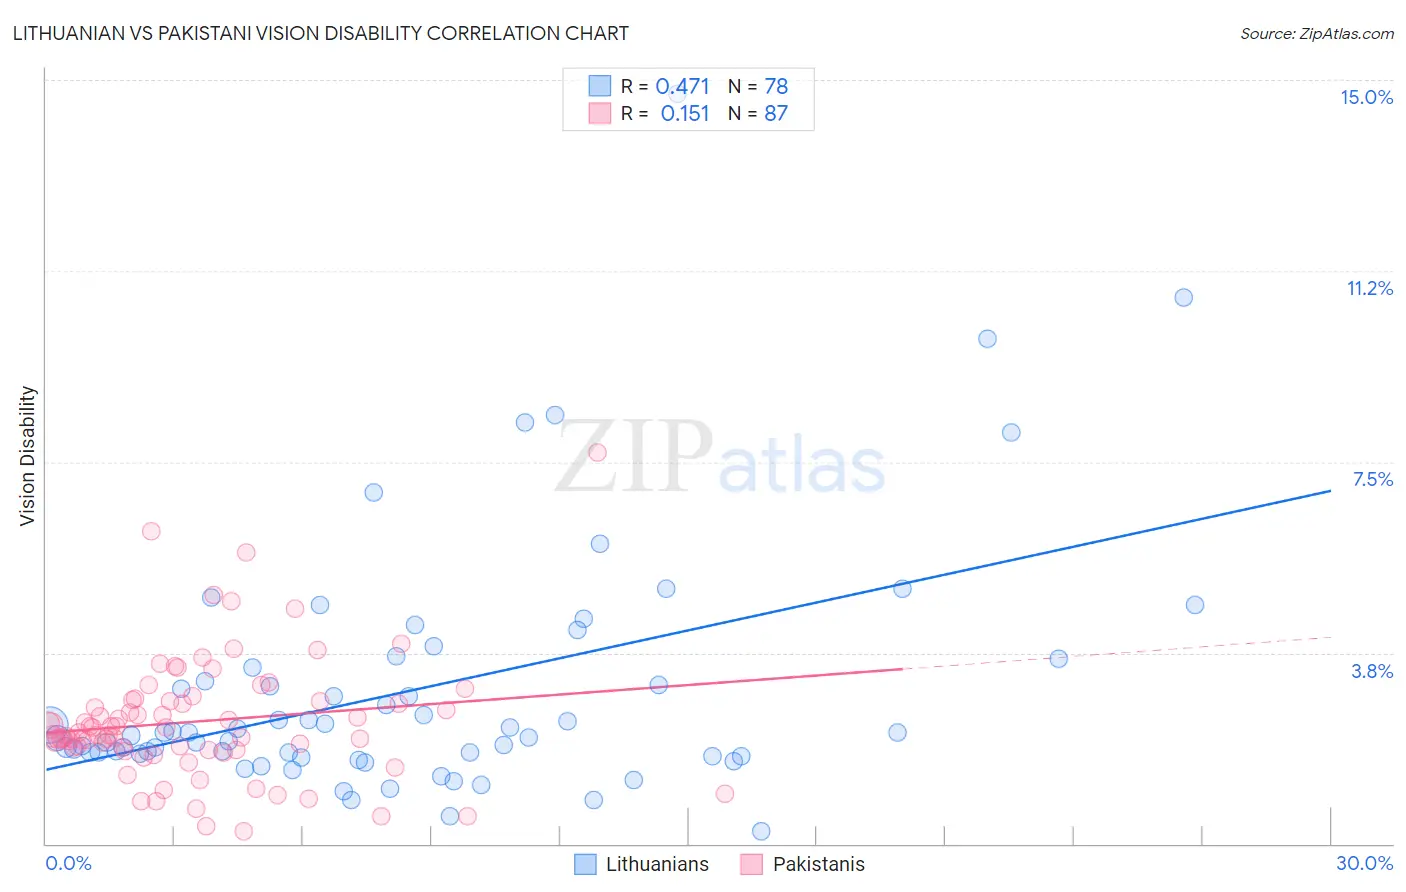
Lithuanian vs Pakistani Vision Disability Correlation Chart
The statistical analysis conducted on geographies consisting of 421,489,399 people shows a moderate positive correlation between the proportion of Lithuanians and percentage of population with vision disability in the United States with a correlation coefficient (R) of 0.471 and weighted average of 2.0%. Similarly, the statistical analysis conducted on geographies consisting of 335,131,498 people shows a poor positive correlation between the proportion of Pakistanis and percentage of population with vision disability in the United States with a correlation coefficient (R) of 0.151 and weighted average of 2.1%, a difference of 4.7%.
Vision Disability Correlation Summary
| Measurement | Lithuanian | Pakistani |
| Minimum | 0.23% | 0.26% |
| Maximum | 14.7% | 7.7% |
| Range | 14.5% | 7.4% |
| Mean | 3.0% | 2.4% |
| Median | 2.2% | 2.1% |
| Interquartile 25% (IQ1) | 1.8% | 1.8% |
| Interquartile 75% (IQ3) | 3.5% | 2.8% |
| Interquartile Range (IQR) | 1.7% | 0.96% |
| Standard Deviation (Sample) | 2.5% | 1.2% |
| Standard Deviation (Population) | 2.4% | 1.2% |
Similar Demographics by Vision Disability
Demographics Similar to Lithuanians by Vision Disability
In terms of vision disability, the demographic groups most similar to Lithuanians are Soviet Union (2.0%, a difference of 0.060%), Immigrants from Poland (2.0%, a difference of 0.090%), Immigrants from Western Asia (2.0%, a difference of 0.17%), Assyrian/Chaldean/Syriac (2.0%, a difference of 0.29%), and Immigrants from Latvia (2.0%, a difference of 0.29%).
| Demographics | Rating | Rank | Vision Disability |
| Immigrants | Eritrea | 98.4 /100 | #73 | Exceptional 2.0% |
| Palestinians | 98.3 /100 | #74 | Exceptional 2.0% |
| Immigrants | North Macedonia | 98.3 /100 | #75 | Exceptional 2.0% |
| Paraguayans | 98.3 /100 | #76 | Exceptional 2.0% |
| Immigrants | Jordan | 98.3 /100 | #77 | Exceptional 2.0% |
| Immigrants | Eastern Europe | 98.3 /100 | #78 | Exceptional 2.0% |
| Assyrians/Chaldeans/Syriacs | 98.1 /100 | #79 | Exceptional 2.0% |
| Lithuanians | 97.7 /100 | #80 | Exceptional 2.0% |
| Soviet Union | 97.6 /100 | #81 | Exceptional 2.0% |
| Immigrants | Poland | 97.6 /100 | #82 | Exceptional 2.0% |
| Immigrants | Western Asia | 97.5 /100 | #83 | Exceptional 2.0% |
| Immigrants | Latvia | 97.3 /100 | #84 | Exceptional 2.0% |
| Chinese | 97.2 /100 | #85 | Exceptional 2.0% |
| Immigrants | Moldova | 97.2 /100 | #86 | Exceptional 2.0% |
| Immigrants | Switzerland | 97.0 /100 | #87 | Exceptional 2.0% |
Demographics Similar to Pakistanis by Vision Disability
In terms of vision disability, the demographic groups most similar to Pakistanis are Immigrants from Colombia (2.1%, a difference of 0.040%), Serbian (2.1%, a difference of 0.11%), Immigrants from Uzbekistan (2.1%, a difference of 0.13%), South African (2.1%, a difference of 0.14%), and Slovene (2.1%, a difference of 0.16%).
| Demographics | Rating | Rank | Vision Disability |
| Colombians | 76.2 /100 | #149 | Good 2.1% |
| Belgians | 75.9 /100 | #150 | Good 2.1% |
| Immigrants | Norway | 75.5 /100 | #151 | Good 2.1% |
| Immigrants | Southern Europe | 74.6 /100 | #152 | Good 2.1% |
| Immigrants | South America | 73.8 /100 | #153 | Good 2.1% |
| Slovenes | 73.6 /100 | #154 | Good 2.1% |
| Immigrants | Colombia | 72.1 /100 | #155 | Good 2.1% |
| Pakistanis | 71.6 /100 | #156 | Good 2.1% |
| Serbians | 70.2 /100 | #157 | Good 2.1% |
| Immigrants | Uzbekistan | 69.9 /100 | #158 | Good 2.1% |
| South Africans | 69.8 /100 | #159 | Good 2.1% |
| Austrians | 69.0 /100 | #160 | Good 2.1% |
| Iraqis | 67.7 /100 | #161 | Good 2.1% |
| Hungarians | 67.4 /100 | #162 | Good 2.1% |
| Icelanders | 66.1 /100 | #163 | Good 2.1% |