Lithuanian vs Immigrants from Senegal Vision Disability
COMPARE
Lithuanian
Immigrants from Senegal
Vision Disability
Vision Disability Comparison
Lithuanians
Immigrants from Senegal
2.0%
VISION DISABILITY
97.7/ 100
METRIC RATING
80th/ 347
METRIC RANK
2.3%
VISION DISABILITY
3.8/ 100
METRIC RATING
222nd/ 347
METRIC RANK
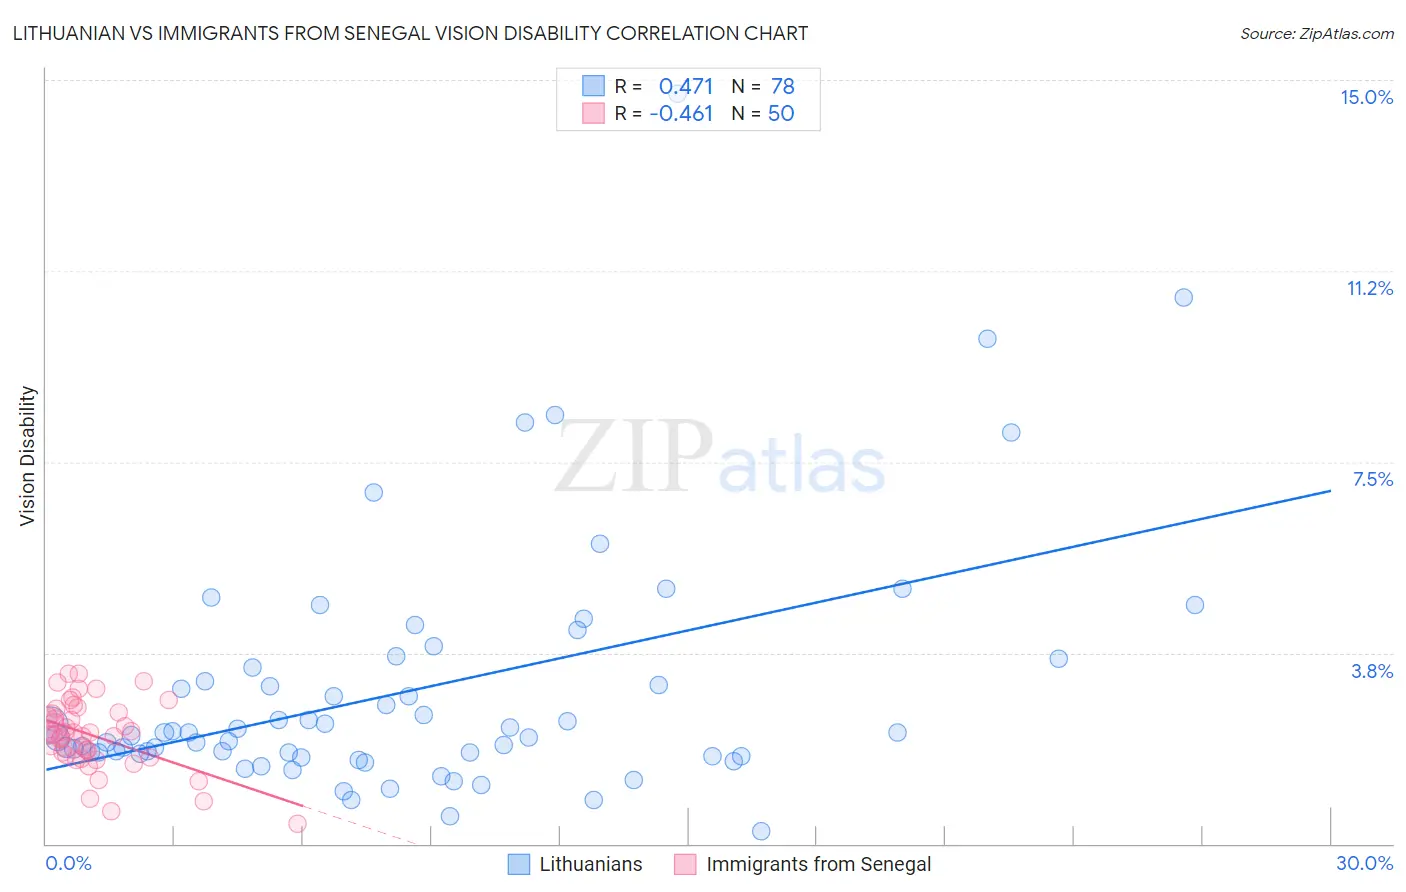
Lithuanian vs Immigrants from Senegal Vision Disability Correlation Chart
The statistical analysis conducted on geographies consisting of 421,489,399 people shows a moderate positive correlation between the proportion of Lithuanians and percentage of population with vision disability in the United States with a correlation coefficient (R) of 0.471 and weighted average of 2.0%. Similarly, the statistical analysis conducted on geographies consisting of 90,101,349 people shows a moderate negative correlation between the proportion of Immigrants from Senegal and percentage of population with vision disability in the United States with a correlation coefficient (R) of -0.461 and weighted average of 2.3%, a difference of 11.7%.
Vision Disability Correlation Summary
| Measurement | Lithuanian | Immigrants from Senegal |
| Minimum | 0.23% | 0.39% |
| Maximum | 14.7% | 3.3% |
| Range | 14.5% | 3.0% |
| Mean | 3.0% | 2.1% |
| Median | 2.2% | 2.2% |
| Interquartile 25% (IQ1) | 1.8% | 1.7% |
| Interquartile 75% (IQ3) | 3.5% | 2.6% |
| Interquartile Range (IQR) | 1.7% | 0.83% |
| Standard Deviation (Sample) | 2.5% | 0.68% |
| Standard Deviation (Population) | 2.4% | 0.67% |
Similar Demographics by Vision Disability
Demographics Similar to Lithuanians by Vision Disability
In terms of vision disability, the demographic groups most similar to Lithuanians are Soviet Union (2.0%, a difference of 0.060%), Immigrants from Poland (2.0%, a difference of 0.090%), Immigrants from Western Asia (2.0%, a difference of 0.17%), Assyrian/Chaldean/Syriac (2.0%, a difference of 0.29%), and Immigrants from Latvia (2.0%, a difference of 0.29%).
| Demographics | Rating | Rank | Vision Disability |
| Immigrants | Eritrea | 98.4 /100 | #73 | Exceptional 2.0% |
| Palestinians | 98.3 /100 | #74 | Exceptional 2.0% |
| Immigrants | North Macedonia | 98.3 /100 | #75 | Exceptional 2.0% |
| Paraguayans | 98.3 /100 | #76 | Exceptional 2.0% |
| Immigrants | Jordan | 98.3 /100 | #77 | Exceptional 2.0% |
| Immigrants | Eastern Europe | 98.3 /100 | #78 | Exceptional 2.0% |
| Assyrians/Chaldeans/Syriacs | 98.1 /100 | #79 | Exceptional 2.0% |
| Lithuanians | 97.7 /100 | #80 | Exceptional 2.0% |
| Soviet Union | 97.6 /100 | #81 | Exceptional 2.0% |
| Immigrants | Poland | 97.6 /100 | #82 | Exceptional 2.0% |
| Immigrants | Western Asia | 97.5 /100 | #83 | Exceptional 2.0% |
| Immigrants | Latvia | 97.3 /100 | #84 | Exceptional 2.0% |
| Chinese | 97.2 /100 | #85 | Exceptional 2.0% |
| Immigrants | Moldova | 97.2 /100 | #86 | Exceptional 2.0% |
| Immigrants | Switzerland | 97.0 /100 | #87 | Exceptional 2.0% |
Demographics Similar to Immigrants from Senegal by Vision Disability
In terms of vision disability, the demographic groups most similar to Immigrants from Senegal are French Canadian (2.3%, a difference of 0.020%), Guamanian/Chamorro (2.3%, a difference of 0.040%), Basque (2.3%, a difference of 0.14%), Irish (2.3%, a difference of 0.17%), and Immigrants from Western Africa (2.3%, a difference of 0.18%).
| Demographics | Rating | Rank | Vision Disability |
| Nigerians | 7.2 /100 | #215 | Tragic 2.3% |
| Immigrants | Trinidad and Tobago | 6.1 /100 | #216 | Tragic 2.3% |
| Barbadians | 5.1 /100 | #217 | Tragic 2.3% |
| Portuguese | 4.9 /100 | #218 | Tragic 2.3% |
| Ecuadorians | 4.6 /100 | #219 | Tragic 2.3% |
| Guamanians/Chamorros | 3.9 /100 | #220 | Tragic 2.3% |
| French Canadians | 3.9 /100 | #221 | Tragic 2.3% |
| Immigrants | Senegal | 3.8 /100 | #222 | Tragic 2.3% |
| Basques | 3.5 /100 | #223 | Tragic 2.3% |
| Irish | 3.4 /100 | #224 | Tragic 2.3% |
| Immigrants | Western Africa | 3.4 /100 | #225 | Tragic 2.3% |
| Immigrants | Germany | 3.0 /100 | #226 | Tragic 2.3% |
| Hawaiians | 2.9 /100 | #227 | Tragic 2.3% |
| Hmong | 2.5 /100 | #228 | Tragic 2.3% |
| Welsh | 2.3 /100 | #229 | Tragic 2.3% |