Immigrants from Serbia vs Alaskan Athabascan Vision Disability
COMPARE
Immigrants from Serbia
Alaskan Athabascan
Vision Disability
Vision Disability Comparison
Immigrants from Serbia
Alaskan Athabascans
2.0%
VISION DISABILITY
99.4/ 100
METRIC RATING
52nd/ 347
METRIC RANK
3.1%
VISION DISABILITY
0.0/ 100
METRIC RATING
336th/ 347
METRIC RANK
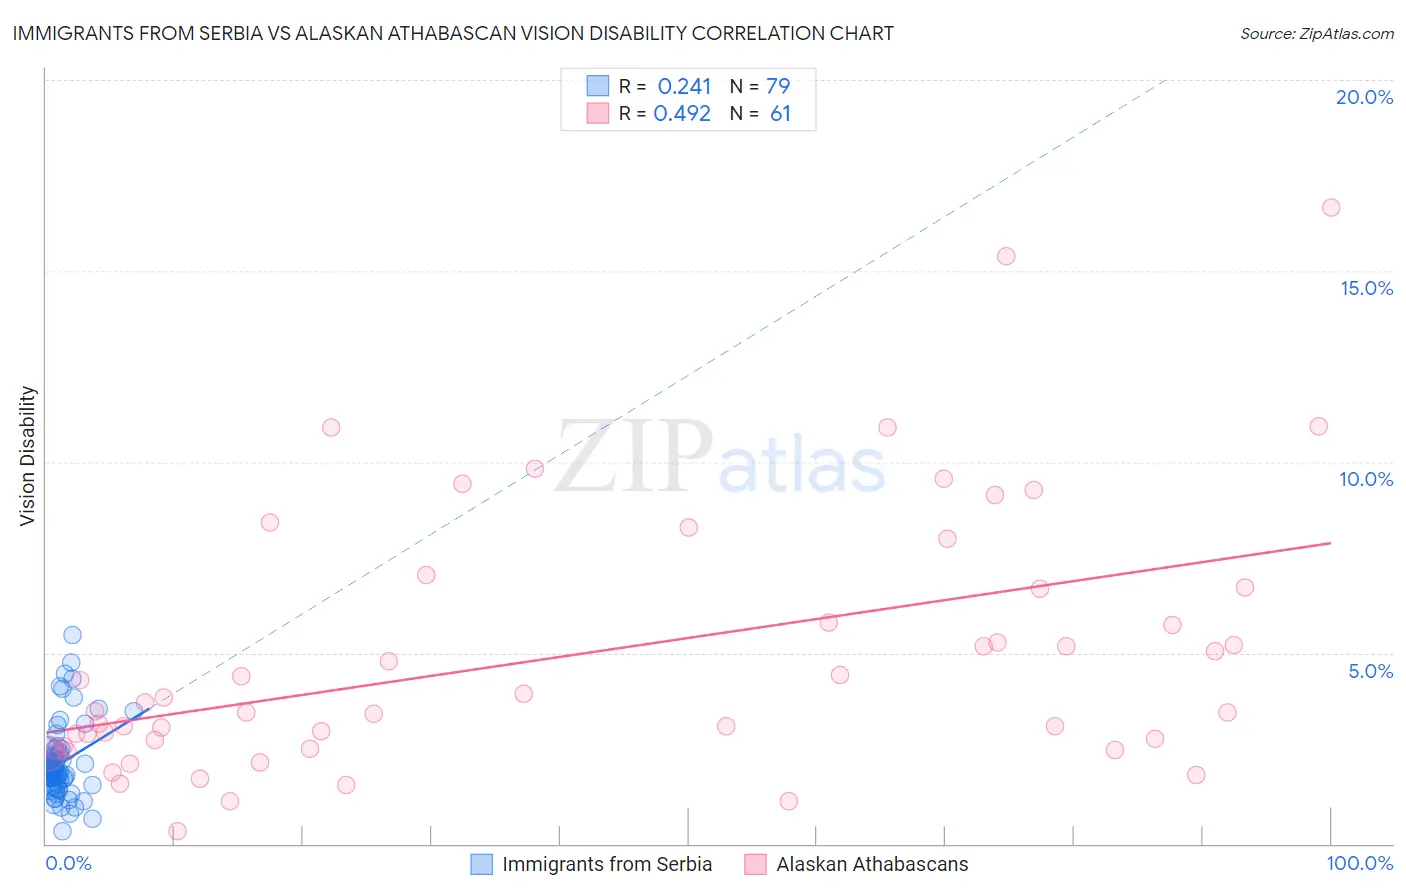
Immigrants from Serbia vs Alaskan Athabascan Vision Disability Correlation Chart
The statistical analysis conducted on geographies consisting of 131,728,789 people shows a weak positive correlation between the proportion of Immigrants from Serbia and percentage of population with vision disability in the United States with a correlation coefficient (R) of 0.241 and weighted average of 2.0%. Similarly, the statistical analysis conducted on geographies consisting of 45,813,116 people shows a moderate positive correlation between the proportion of Alaskan Athabascans and percentage of population with vision disability in the United States with a correlation coefficient (R) of 0.492 and weighted average of 3.1%, a difference of 58.1%.
Vision Disability Correlation Summary
| Measurement | Immigrants from Serbia | Alaskan Athabascan |
| Minimum | 0.34% | 0.32% |
| Maximum | 5.5% | 16.7% |
| Range | 5.1% | 16.4% |
| Mean | 2.1% | 4.9% |
| Median | 1.9% | 3.5% |
| Interquartile 25% (IQ1) | 1.6% | 2.5% |
| Interquartile 75% (IQ3) | 2.3% | 6.7% |
| Interquartile Range (IQR) | 0.72% | 4.2% |
| Standard Deviation (Sample) | 0.94% | 3.4% |
| Standard Deviation (Population) | 0.94% | 3.4% |
Similar Demographics by Vision Disability
Demographics Similar to Immigrants from Serbia by Vision Disability
In terms of vision disability, the demographic groups most similar to Immigrants from Serbia are Immigrants from Belarus (2.0%, a difference of 0.11%), Macedonian (2.0%, a difference of 0.15%), Laotian (2.0%, a difference of 0.21%), Tongan (2.0%, a difference of 0.31%), and Jordanian (2.0%, a difference of 0.37%).
| Demographics | Rating | Rank | Vision Disability |
| Ethiopians | 99.7 /100 | #45 | Exceptional 2.0% |
| Immigrants | Sweden | 99.7 /100 | #46 | Exceptional 2.0% |
| Immigrants | Bulgaria | 99.7 /100 | #47 | Exceptional 2.0% |
| Israelis | 99.6 /100 | #48 | Exceptional 2.0% |
| Latvians | 99.5 /100 | #49 | Exceptional 2.0% |
| Afghans | 99.5 /100 | #50 | Exceptional 2.0% |
| Tongans | 99.5 /100 | #51 | Exceptional 2.0% |
| Immigrants | Serbia | 99.4 /100 | #52 | Exceptional 2.0% |
| Immigrants | Belarus | 99.3 /100 | #53 | Exceptional 2.0% |
| Macedonians | 99.3 /100 | #54 | Exceptional 2.0% |
| Laotians | 99.3 /100 | #55 | Exceptional 2.0% |
| Jordanians | 99.2 /100 | #56 | Exceptional 2.0% |
| Somalis | 99.2 /100 | #57 | Exceptional 2.0% |
| Immigrants | Saudi Arabia | 99.2 /100 | #58 | Exceptional 2.0% |
| Argentineans | 99.1 /100 | #59 | Exceptional 2.0% |
Demographics Similar to Alaskan Athabascans by Vision Disability
In terms of vision disability, the demographic groups most similar to Alaskan Athabascans are Dutch West Indian (3.2%, a difference of 0.030%), Navajo (3.1%, a difference of 0.16%), Chickasaw (3.2%, a difference of 0.93%), Tsimshian (3.2%, a difference of 1.6%), and Creek (3.2%, a difference of 1.8%).
| Demographics | Rating | Rank | Vision Disability |
| Apache | 0.0 /100 | #329 | Tragic 3.0% |
| Colville | 0.0 /100 | #330 | Tragic 3.0% |
| Central American Indians | 0.0 /100 | #331 | Tragic 3.0% |
| Seminole | 0.0 /100 | #332 | Tragic 3.1% |
| Cajuns | 0.0 /100 | #333 | Tragic 3.1% |
| Cheyenne | 0.0 /100 | #334 | Tragic 3.1% |
| Navajo | 0.0 /100 | #335 | Tragic 3.1% |
| Alaskan Athabascans | 0.0 /100 | #336 | Tragic 3.1% |
| Dutch West Indians | 0.0 /100 | #337 | Tragic 3.2% |
| Chickasaw | 0.0 /100 | #338 | Tragic 3.2% |
| Tsimshian | 0.0 /100 | #339 | Tragic 3.2% |
| Creek | 0.0 /100 | #340 | Tragic 3.2% |
| Kiowa | 0.0 /100 | #341 | Tragic 3.3% |
| Choctaw | 0.0 /100 | #342 | Tragic 3.3% |
| Pima | 0.0 /100 | #343 | Tragic 3.3% |