Pakistani vs Alaskan Athabascan Vision Disability
COMPARE
Pakistani
Alaskan Athabascan
Vision Disability
Vision Disability Comparison
Pakistanis
Alaskan Athabascans
2.1%
VISION DISABILITY
71.6/ 100
METRIC RATING
156th/ 347
METRIC RANK
3.1%
VISION DISABILITY
0.0/ 100
METRIC RATING
336th/ 347
METRIC RANK
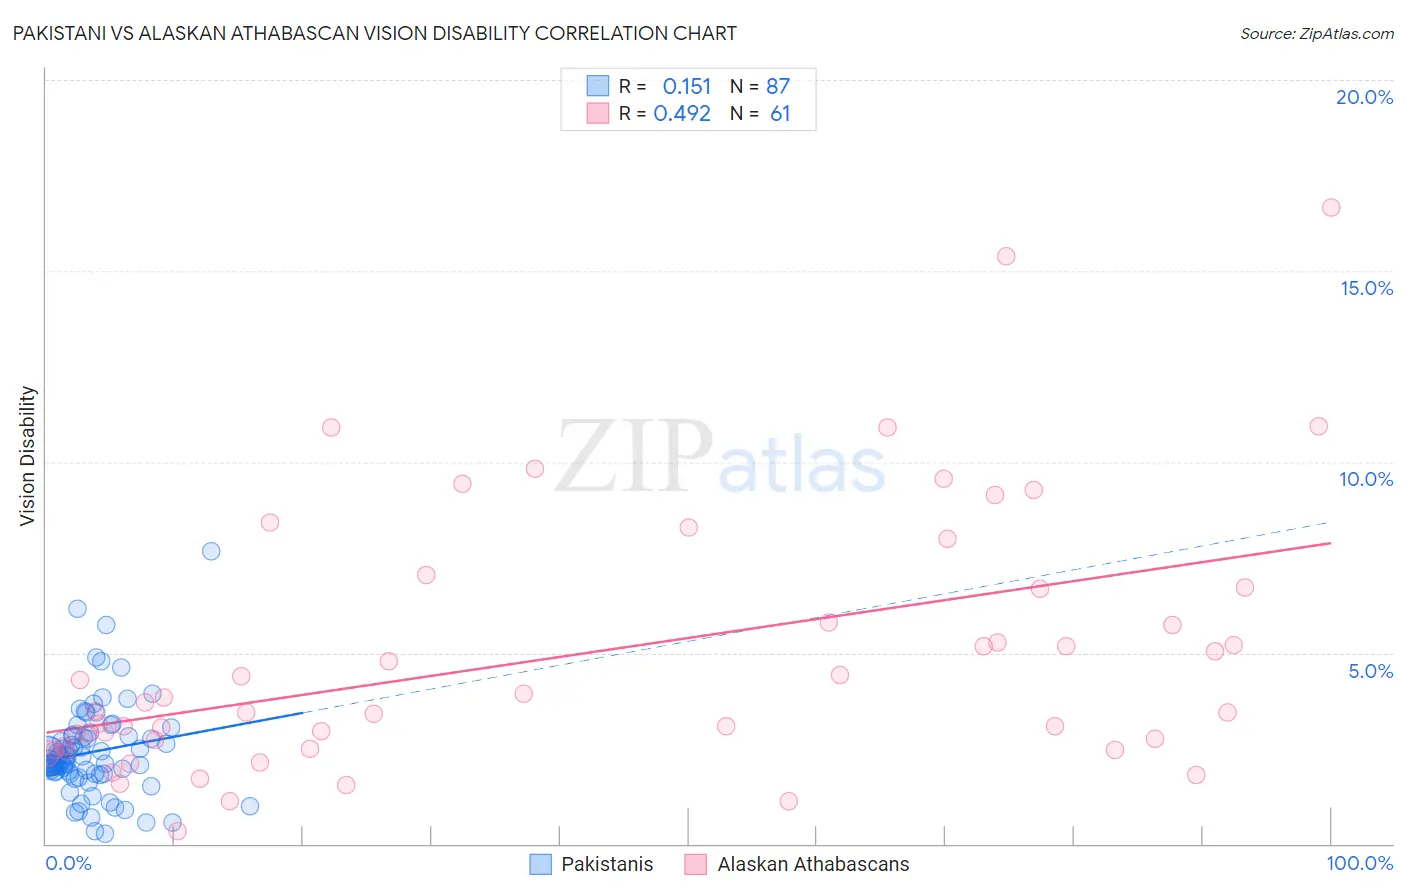
Pakistani vs Alaskan Athabascan Vision Disability Correlation Chart
The statistical analysis conducted on geographies consisting of 335,131,498 people shows a poor positive correlation between the proportion of Pakistanis and percentage of population with vision disability in the United States with a correlation coefficient (R) of 0.151 and weighted average of 2.1%. Similarly, the statistical analysis conducted on geographies consisting of 45,813,116 people shows a moderate positive correlation between the proportion of Alaskan Athabascans and percentage of population with vision disability in the United States with a correlation coefficient (R) of 0.492 and weighted average of 3.1%, a difference of 47.5%.
Vision Disability Correlation Summary
| Measurement | Pakistani | Alaskan Athabascan |
| Minimum | 0.26% | 0.32% |
| Maximum | 7.7% | 16.7% |
| Range | 7.4% | 16.4% |
| Mean | 2.4% | 4.9% |
| Median | 2.1% | 3.5% |
| Interquartile 25% (IQ1) | 1.8% | 2.5% |
| Interquartile 75% (IQ3) | 2.8% | 6.7% |
| Interquartile Range (IQR) | 0.96% | 4.2% |
| Standard Deviation (Sample) | 1.2% | 3.4% |
| Standard Deviation (Population) | 1.2% | 3.4% |
Similar Demographics by Vision Disability
Demographics Similar to Pakistanis by Vision Disability
In terms of vision disability, the demographic groups most similar to Pakistanis are Immigrants from Colombia (2.1%, a difference of 0.040%), Serbian (2.1%, a difference of 0.11%), Immigrants from Uzbekistan (2.1%, a difference of 0.13%), South African (2.1%, a difference of 0.14%), and Slovene (2.1%, a difference of 0.16%).
| Demographics | Rating | Rank | Vision Disability |
| Colombians | 76.2 /100 | #149 | Good 2.1% |
| Belgians | 75.9 /100 | #150 | Good 2.1% |
| Immigrants | Norway | 75.5 /100 | #151 | Good 2.1% |
| Immigrants | Southern Europe | 74.6 /100 | #152 | Good 2.1% |
| Immigrants | South America | 73.8 /100 | #153 | Good 2.1% |
| Slovenes | 73.6 /100 | #154 | Good 2.1% |
| Immigrants | Colombia | 72.1 /100 | #155 | Good 2.1% |
| Pakistanis | 71.6 /100 | #156 | Good 2.1% |
| Serbians | 70.2 /100 | #157 | Good 2.1% |
| Immigrants | Uzbekistan | 69.9 /100 | #158 | Good 2.1% |
| South Africans | 69.8 /100 | #159 | Good 2.1% |
| Austrians | 69.0 /100 | #160 | Good 2.1% |
| Iraqis | 67.7 /100 | #161 | Good 2.1% |
| Hungarians | 67.4 /100 | #162 | Good 2.1% |
| Icelanders | 66.1 /100 | #163 | Good 2.1% |
Demographics Similar to Alaskan Athabascans by Vision Disability
In terms of vision disability, the demographic groups most similar to Alaskan Athabascans are Dutch West Indian (3.2%, a difference of 0.030%), Navajo (3.1%, a difference of 0.16%), Chickasaw (3.2%, a difference of 0.93%), Tsimshian (3.2%, a difference of 1.6%), and Creek (3.2%, a difference of 1.8%).
| Demographics | Rating | Rank | Vision Disability |
| Apache | 0.0 /100 | #329 | Tragic 3.0% |
| Colville | 0.0 /100 | #330 | Tragic 3.0% |
| Central American Indians | 0.0 /100 | #331 | Tragic 3.0% |
| Seminole | 0.0 /100 | #332 | Tragic 3.1% |
| Cajuns | 0.0 /100 | #333 | Tragic 3.1% |
| Cheyenne | 0.0 /100 | #334 | Tragic 3.1% |
| Navajo | 0.0 /100 | #335 | Tragic 3.1% |
| Alaskan Athabascans | 0.0 /100 | #336 | Tragic 3.1% |
| Dutch West Indians | 0.0 /100 | #337 | Tragic 3.2% |
| Chickasaw | 0.0 /100 | #338 | Tragic 3.2% |
| Tsimshian | 0.0 /100 | #339 | Tragic 3.2% |
| Creek | 0.0 /100 | #340 | Tragic 3.2% |
| Kiowa | 0.0 /100 | #341 | Tragic 3.3% |
| Choctaw | 0.0 /100 | #342 | Tragic 3.3% |
| Pima | 0.0 /100 | #343 | Tragic 3.3% |