Lithuanian vs Laotian Vision Disability
COMPARE
Lithuanian
Laotian
Vision Disability
Vision Disability Comparison
Lithuanians
Laotians
2.0%
VISION DISABILITY
97.7/ 100
METRIC RATING
80th/ 347
METRIC RANK
2.0%
VISION DISABILITY
99.3/ 100
METRIC RATING
55th/ 347
METRIC RANK
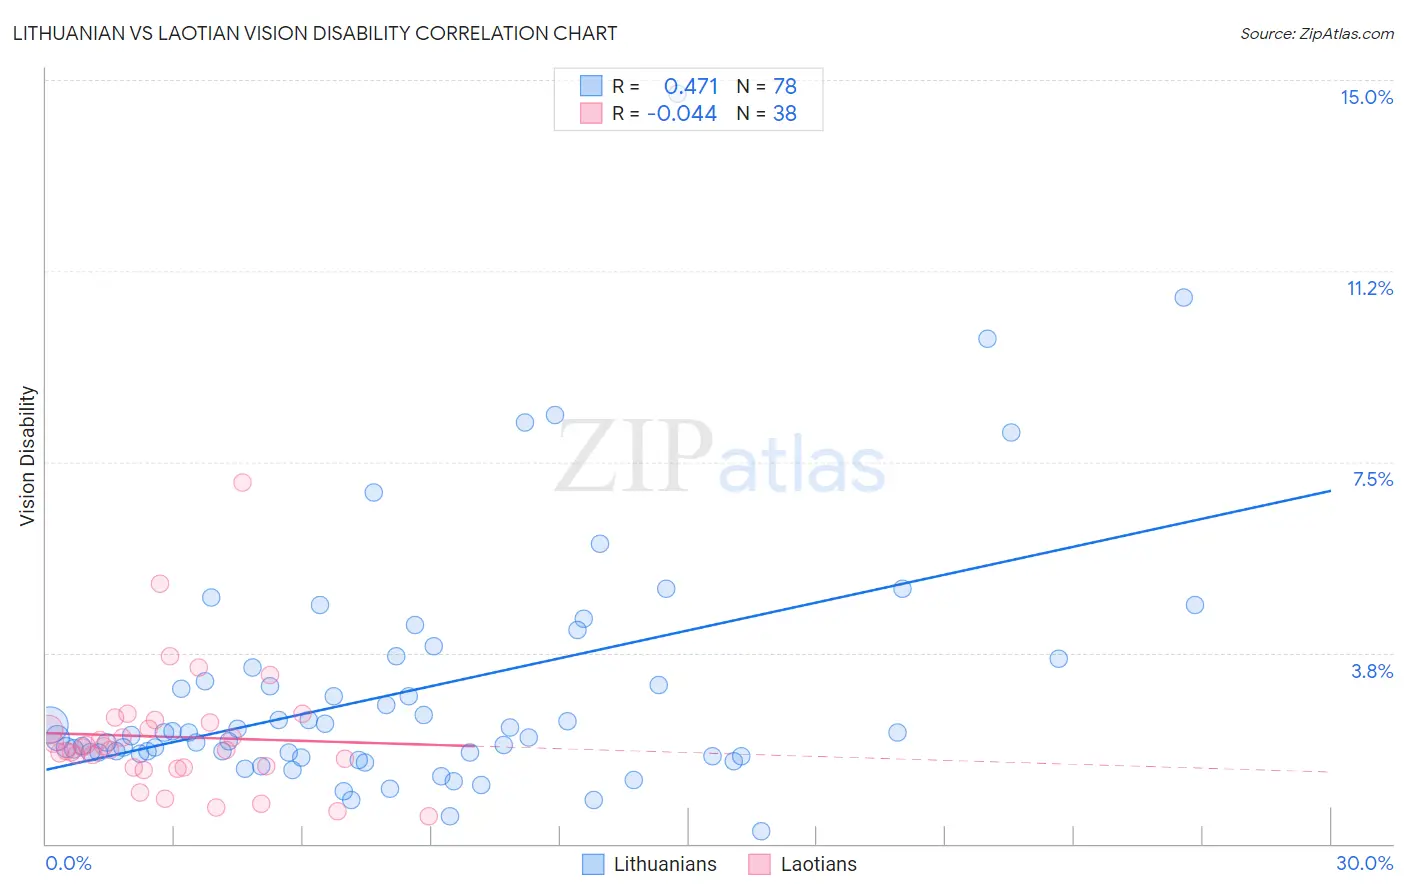
Lithuanian vs Laotian Vision Disability Correlation Chart
The statistical analysis conducted on geographies consisting of 421,489,399 people shows a moderate positive correlation between the proportion of Lithuanians and percentage of population with vision disability in the United States with a correlation coefficient (R) of 0.471 and weighted average of 2.0%. Similarly, the statistical analysis conducted on geographies consisting of 224,815,117 people shows no correlation between the proportion of Laotians and percentage of population with vision disability in the United States with a correlation coefficient (R) of -0.044 and weighted average of 2.0%, a difference of 2.1%.
Vision Disability Correlation Summary
| Measurement | Lithuanian | Laotian |
| Minimum | 0.23% | 0.55% |
| Maximum | 14.7% | 7.1% |
| Range | 14.5% | 6.5% |
| Mean | 3.0% | 2.1% |
| Median | 2.2% | 1.9% |
| Interquartile 25% (IQ1) | 1.8% | 1.5% |
| Interquartile 75% (IQ3) | 3.5% | 2.4% |
| Interquartile Range (IQR) | 1.7% | 0.88% |
| Standard Deviation (Sample) | 2.5% | 1.2% |
| Standard Deviation (Population) | 2.4% | 1.2% |
Similar Demographics by Vision Disability
Demographics Similar to Lithuanians by Vision Disability
In terms of vision disability, the demographic groups most similar to Lithuanians are Soviet Union (2.0%, a difference of 0.060%), Immigrants from Poland (2.0%, a difference of 0.090%), Immigrants from Western Asia (2.0%, a difference of 0.17%), Assyrian/Chaldean/Syriac (2.0%, a difference of 0.29%), and Immigrants from Latvia (2.0%, a difference of 0.29%).
| Demographics | Rating | Rank | Vision Disability |
| Immigrants | Eritrea | 98.4 /100 | #73 | Exceptional 2.0% |
| Palestinians | 98.3 /100 | #74 | Exceptional 2.0% |
| Immigrants | North Macedonia | 98.3 /100 | #75 | Exceptional 2.0% |
| Paraguayans | 98.3 /100 | #76 | Exceptional 2.0% |
| Immigrants | Jordan | 98.3 /100 | #77 | Exceptional 2.0% |
| Immigrants | Eastern Europe | 98.3 /100 | #78 | Exceptional 2.0% |
| Assyrians/Chaldeans/Syriacs | 98.1 /100 | #79 | Exceptional 2.0% |
| Lithuanians | 97.7 /100 | #80 | Exceptional 2.0% |
| Soviet Union | 97.6 /100 | #81 | Exceptional 2.0% |
| Immigrants | Poland | 97.6 /100 | #82 | Exceptional 2.0% |
| Immigrants | Western Asia | 97.5 /100 | #83 | Exceptional 2.0% |
| Immigrants | Latvia | 97.3 /100 | #84 | Exceptional 2.0% |
| Chinese | 97.2 /100 | #85 | Exceptional 2.0% |
| Immigrants | Moldova | 97.2 /100 | #86 | Exceptional 2.0% |
| Immigrants | Switzerland | 97.0 /100 | #87 | Exceptional 2.0% |
Demographics Similar to Laotians by Vision Disability
In terms of vision disability, the demographic groups most similar to Laotians are Macedonian (2.0%, a difference of 0.060%), Immigrants from Belarus (2.0%, a difference of 0.090%), Jordanian (2.0%, a difference of 0.17%), Somali (2.0%, a difference of 0.19%), and Immigrants from Serbia (2.0%, a difference of 0.21%).
| Demographics | Rating | Rank | Vision Disability |
| Israelis | 99.6 /100 | #48 | Exceptional 2.0% |
| Latvians | 99.5 /100 | #49 | Exceptional 2.0% |
| Afghans | 99.5 /100 | #50 | Exceptional 2.0% |
| Tongans | 99.5 /100 | #51 | Exceptional 2.0% |
| Immigrants | Serbia | 99.4 /100 | #52 | Exceptional 2.0% |
| Immigrants | Belarus | 99.3 /100 | #53 | Exceptional 2.0% |
| Macedonians | 99.3 /100 | #54 | Exceptional 2.0% |
| Laotians | 99.3 /100 | #55 | Exceptional 2.0% |
| Jordanians | 99.2 /100 | #56 | Exceptional 2.0% |
| Somalis | 99.2 /100 | #57 | Exceptional 2.0% |
| Immigrants | Saudi Arabia | 99.2 /100 | #58 | Exceptional 2.0% |
| Argentineans | 99.1 /100 | #59 | Exceptional 2.0% |
| Immigrants | Romania | 99.1 /100 | #60 | Exceptional 2.0% |
| Immigrants | Belgium | 99.1 /100 | #61 | Exceptional 2.0% |
| Immigrants | Russia | 99.1 /100 | #62 | Exceptional 2.0% |