Lithuanian vs Immigrants from Israel Vision Disability
COMPARE
Lithuanian
Immigrants from Israel
Vision Disability
Vision Disability Comparison
Lithuanians
Immigrants from Israel
2.0%
VISION DISABILITY
97.7/ 100
METRIC RATING
80th/ 347
METRIC RANK
1.8%
VISION DISABILITY
100.0/ 100
METRIC RATING
11th/ 347
METRIC RANK
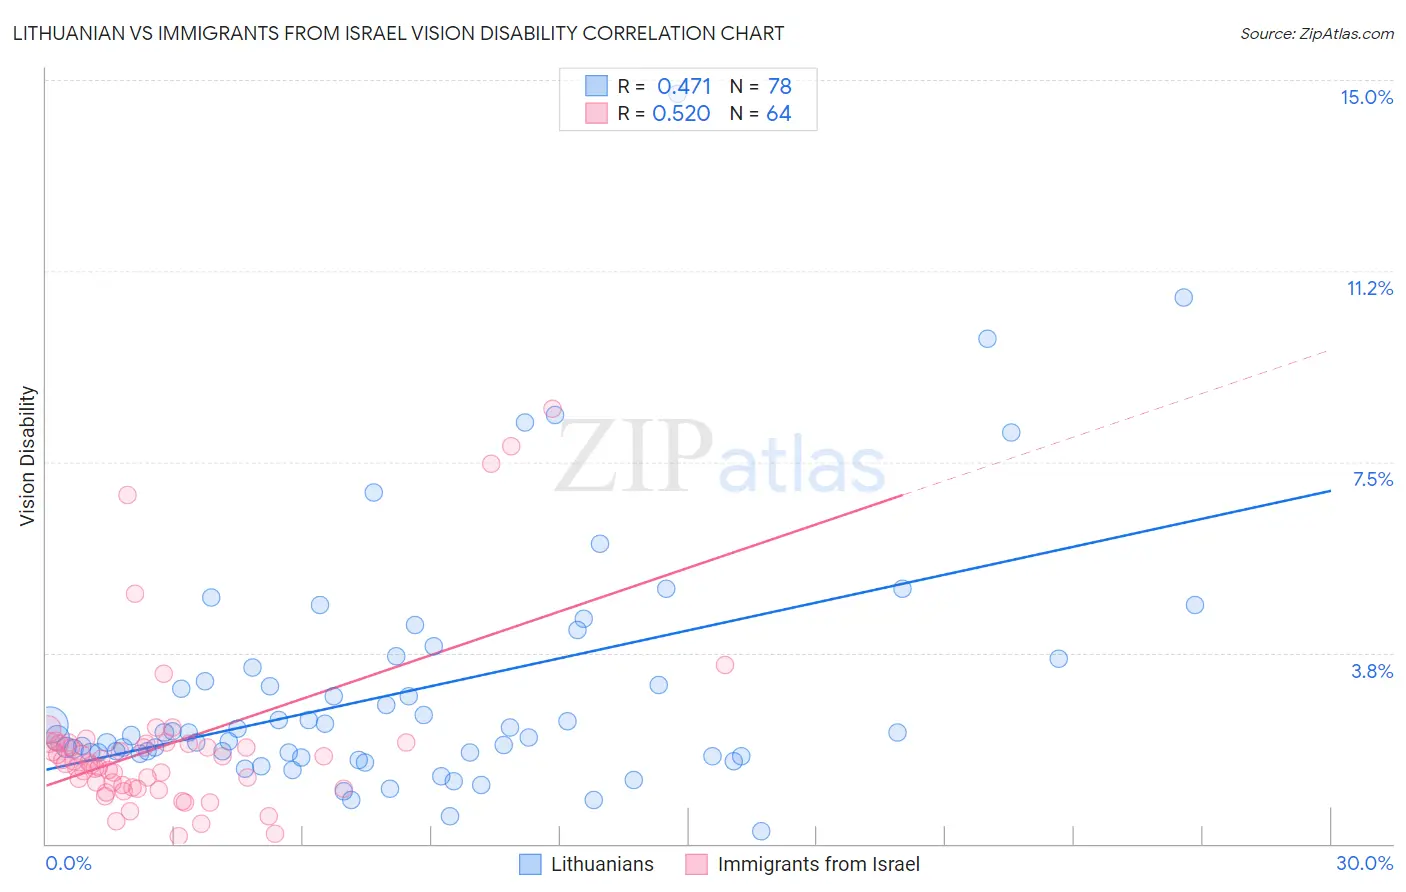
Lithuanian vs Immigrants from Israel Vision Disability Correlation Chart
The statistical analysis conducted on geographies consisting of 421,489,399 people shows a moderate positive correlation between the proportion of Lithuanians and percentage of population with vision disability in the United States with a correlation coefficient (R) of 0.471 and weighted average of 2.0%. Similarly, the statistical analysis conducted on geographies consisting of 209,958,644 people shows a substantial positive correlation between the proportion of Immigrants from Israel and percentage of population with vision disability in the United States with a correlation coefficient (R) of 0.520 and weighted average of 1.8%, a difference of 11.7%.
Vision Disability Correlation Summary
| Measurement | Lithuanian | Immigrants from Israel |
| Minimum | 0.23% | 0.15% |
| Maximum | 14.7% | 8.5% |
| Range | 14.5% | 8.4% |
| Mean | 3.0% | 1.9% |
| Median | 2.2% | 1.6% |
| Interquartile 25% (IQ1) | 1.8% | 1.1% |
| Interquartile 75% (IQ3) | 3.5% | 2.0% |
| Interquartile Range (IQR) | 1.7% | 0.84% |
| Standard Deviation (Sample) | 2.5% | 1.7% |
| Standard Deviation (Population) | 2.4% | 1.7% |
Similar Demographics by Vision Disability
Demographics Similar to Lithuanians by Vision Disability
In terms of vision disability, the demographic groups most similar to Lithuanians are Soviet Union (2.0%, a difference of 0.060%), Immigrants from Poland (2.0%, a difference of 0.090%), Immigrants from Western Asia (2.0%, a difference of 0.17%), Assyrian/Chaldean/Syriac (2.0%, a difference of 0.29%), and Immigrants from Latvia (2.0%, a difference of 0.29%).
| Demographics | Rating | Rank | Vision Disability |
| Immigrants | Eritrea | 98.4 /100 | #73 | Exceptional 2.0% |
| Palestinians | 98.3 /100 | #74 | Exceptional 2.0% |
| Immigrants | North Macedonia | 98.3 /100 | #75 | Exceptional 2.0% |
| Paraguayans | 98.3 /100 | #76 | Exceptional 2.0% |
| Immigrants | Jordan | 98.3 /100 | #77 | Exceptional 2.0% |
| Immigrants | Eastern Europe | 98.3 /100 | #78 | Exceptional 2.0% |
| Assyrians/Chaldeans/Syriacs | 98.1 /100 | #79 | Exceptional 2.0% |
| Lithuanians | 97.7 /100 | #80 | Exceptional 2.0% |
| Soviet Union | 97.6 /100 | #81 | Exceptional 2.0% |
| Immigrants | Poland | 97.6 /100 | #82 | Exceptional 2.0% |
| Immigrants | Western Asia | 97.5 /100 | #83 | Exceptional 2.0% |
| Immigrants | Latvia | 97.3 /100 | #84 | Exceptional 2.0% |
| Chinese | 97.2 /100 | #85 | Exceptional 2.0% |
| Immigrants | Moldova | 97.2 /100 | #86 | Exceptional 2.0% |
| Immigrants | Switzerland | 97.0 /100 | #87 | Exceptional 2.0% |
Demographics Similar to Immigrants from Israel by Vision Disability
In terms of vision disability, the demographic groups most similar to Immigrants from Israel are Immigrants from Korea (1.8%, a difference of 0.23%), Immigrants from Eastern Asia (1.8%, a difference of 0.31%), Immigrants from China (1.8%, a difference of 0.45%), Immigrants from Bolivia (1.8%, a difference of 0.88%), and Immigrants from Hong Kong (1.8%, a difference of 1.1%).
| Demographics | Rating | Rank | Vision Disability |
| Thais | 100.0 /100 | #4 | Exceptional 1.7% |
| Okinawans | 100.0 /100 | #5 | Exceptional 1.8% |
| Immigrants | Iran | 100.0 /100 | #6 | Exceptional 1.8% |
| Immigrants | South Central Asia | 100.0 /100 | #7 | Exceptional 1.8% |
| Iranians | 100.0 /100 | #8 | Exceptional 1.8% |
| Immigrants | Singapore | 100.0 /100 | #9 | Exceptional 1.8% |
| Immigrants | Hong Kong | 100.0 /100 | #10 | Exceptional 1.8% |
| Immigrants | Israel | 100.0 /100 | #11 | Exceptional 1.8% |
| Immigrants | Korea | 100.0 /100 | #12 | Exceptional 1.8% |
| Immigrants | Eastern Asia | 100.0 /100 | #13 | Exceptional 1.8% |
| Immigrants | China | 100.0 /100 | #14 | Exceptional 1.8% |
| Immigrants | Bolivia | 100.0 /100 | #15 | Exceptional 1.8% |
| Indians (Asian) | 100.0 /100 | #16 | Exceptional 1.8% |
| Burmese | 100.0 /100 | #17 | Exceptional 1.8% |
| Bolivians | 100.0 /100 | #18 | Exceptional 1.9% |