Immigrants from Norway vs Afghan Disability Age Under 5
COMPARE
Immigrants from Norway
Afghan
Disability Age Under 5
Disability Age Under 5 Comparison
Immigrants from Norway
Afghans
1.3%
DISABILITY AGE UNDER 5
31.1/ 100
METRIC RATING
198th/ 347
METRIC RANK
0.94%
DISABILITY AGE UNDER 5
100.0/ 100
METRIC RATING
11th/ 347
METRIC RANK
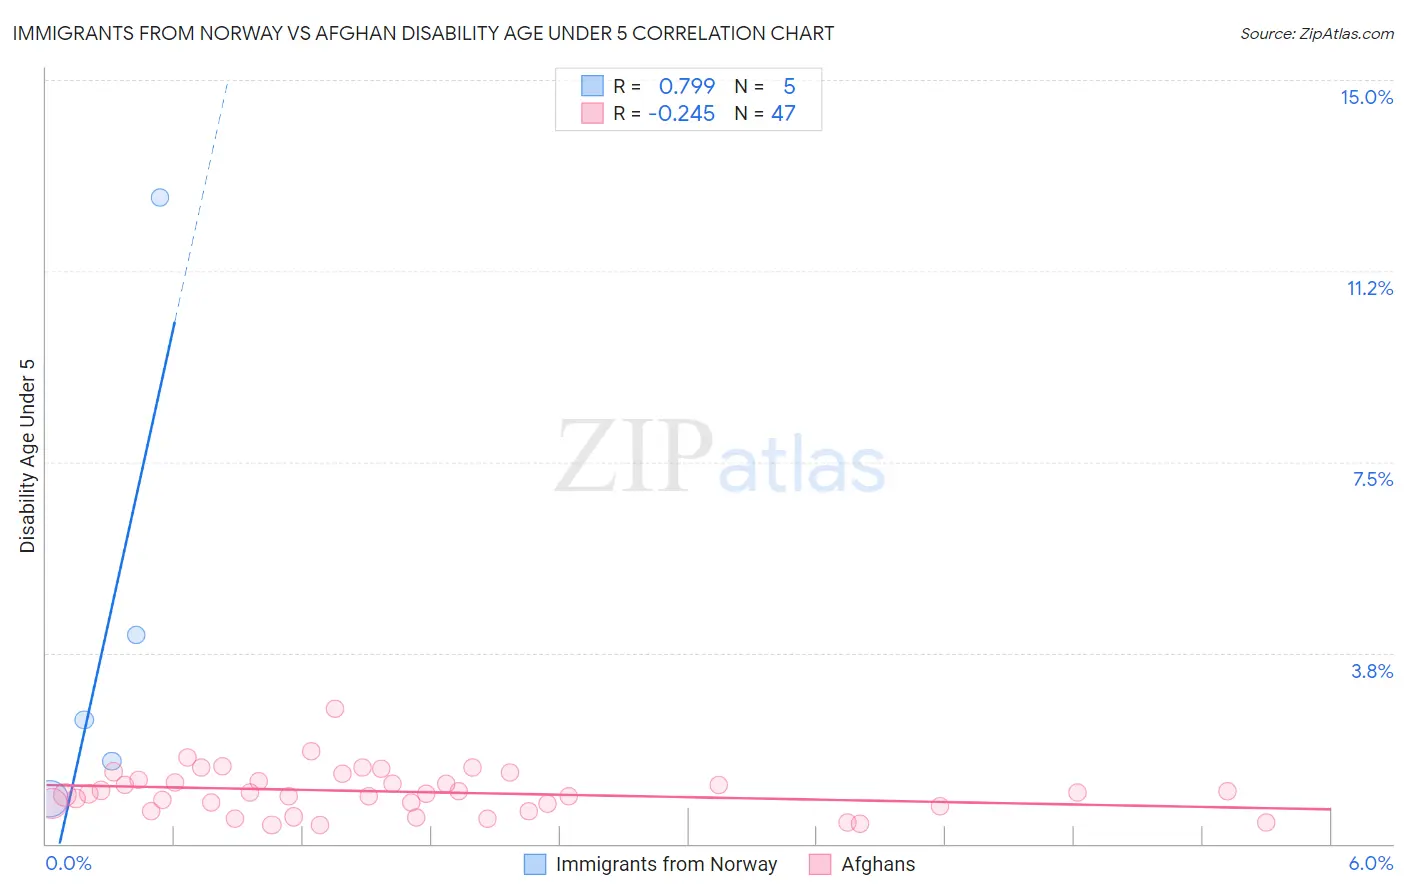
Immigrants from Norway vs Afghan Disability Age Under 5 Correlation Chart
The statistical analysis conducted on geographies consisting of 84,343,493 people shows a strong positive correlation between the proportion of Immigrants from Norway and percentage of population with a disability under the age of 5 in the United States with a correlation coefficient (R) of 0.799 and weighted average of 1.3%. Similarly, the statistical analysis conducted on geographies consisting of 107,918,931 people shows a weak negative correlation between the proportion of Afghans and percentage of population with a disability under the age of 5 in the United States with a correlation coefficient (R) of -0.245 and weighted average of 0.94%, a difference of 33.7%.
Disability Age Under 5 Correlation Summary
| Measurement | Immigrants from Norway | Afghan |
| Minimum | 0.87% | 0.37% |
| Maximum | 12.7% | 2.7% |
| Range | 11.8% | 2.3% |
| Mean | 4.3% | 1.0% |
| Median | 2.4% | 0.99% |
| Interquartile 25% (IQ1) | 1.2% | 0.74% |
| Interquartile 75% (IQ3) | 8.4% | 1.3% |
| Interquartile Range (IQR) | 7.2% | 0.52% |
| Standard Deviation (Sample) | 4.8% | 0.45% |
| Standard Deviation (Population) | 4.3% | 0.44% |
Similar Demographics by Disability Age Under 5
Demographics Similar to Immigrants from Norway by Disability Age Under 5
In terms of disability age under 5, the demographic groups most similar to Immigrants from Norway are Immigrants from Somalia (1.3%, a difference of 0.030%), Immigrants from Belgium (1.3%, a difference of 0.040%), Jamaican (1.3%, a difference of 0.040%), U.S. Virgin Islander (1.3%, a difference of 0.34%), and Immigrants from North Macedonia (1.3%, a difference of 0.37%).
| Demographics | Rating | Rank | Disability Age Under 5 |
| Mexican American Indians | 36.6 /100 | #191 | Fair 1.3% |
| Immigrants | Bosnia and Herzegovina | 36.5 /100 | #192 | Fair 1.3% |
| Immigrants | Sierra Leone | 36.5 /100 | #193 | Fair 1.3% |
| Immigrants | North Macedonia | 34.7 /100 | #194 | Fair 1.3% |
| U.S. Virgin Islanders | 34.4 /100 | #195 | Fair 1.3% |
| Immigrants | Belgium | 31.4 /100 | #196 | Fair 1.3% |
| Immigrants | Somalia | 31.3 /100 | #197 | Fair 1.3% |
| Immigrants | Norway | 31.1 /100 | #198 | Fair 1.3% |
| Jamaicans | 30.7 /100 | #199 | Fair 1.3% |
| Immigrants | Lithuania | 27.2 /100 | #200 | Fair 1.3% |
| Immigrants | Italy | 25.4 /100 | #201 | Fair 1.3% |
| Arapaho | 24.1 /100 | #202 | Fair 1.3% |
| Liberians | 24.0 /100 | #203 | Fair 1.3% |
| Immigrants | Europe | 23.6 /100 | #204 | Fair 1.3% |
| Romanians | 22.5 /100 | #205 | Fair 1.3% |
Demographics Similar to Afghans by Disability Age Under 5
In terms of disability age under 5, the demographic groups most similar to Afghans are Immigrants from Grenada (0.94%, a difference of 0.020%), Soviet Union (0.95%, a difference of 0.19%), Yuman (0.95%, a difference of 0.27%), Immigrants from Hong Kong (0.95%, a difference of 0.30%), and Marshallese (0.94%, a difference of 0.76%).
| Demographics | Rating | Rank | Disability Age Under 5 |
| Immigrants | Uzbekistan | 100.0 /100 | #4 | Exceptional 0.85% |
| Immigrants | Bangladesh | 100.0 /100 | #5 | Exceptional 0.85% |
| Ute | 100.0 /100 | #6 | Exceptional 0.86% |
| Immigrants | Afghanistan | 100.0 /100 | #7 | Exceptional 0.91% |
| Immigrants | Yemen | 100.0 /100 | #8 | Exceptional 0.91% |
| Immigrants | Fiji | 100.0 /100 | #9 | Exceptional 0.92% |
| Marshallese | 100.0 /100 | #10 | Exceptional 0.94% |
| Afghans | 100.0 /100 | #11 | Exceptional 0.94% |
| Immigrants | Grenada | 100.0 /100 | #12 | Exceptional 0.94% |
| Soviet Union | 100.0 /100 | #13 | Exceptional 0.95% |
| Yuman | 100.0 /100 | #14 | Exceptional 0.95% |
| Immigrants | Hong Kong | 100.0 /100 | #15 | Exceptional 0.95% |
| Immigrants | Israel | 100.0 /100 | #16 | Exceptional 0.96% |
| Immigrants | China | 100.0 /100 | #17 | Exceptional 0.96% |
| Immigrants | Barbados | 100.0 /100 | #18 | Exceptional 0.97% |