Liberian vs Czech Disability Age Under 5
COMPARE
Liberian
Czech
Disability Age Under 5
Disability Age Under 5 Comparison
Liberians
Czechs
1.3%
DISABILITY AGE UNDER 5
24.0/ 100
METRIC RATING
203rd/ 347
METRIC RANK
1.5%
DISABILITY AGE UNDER 5
0.0/ 100
METRIC RATING
290th/ 347
METRIC RANK
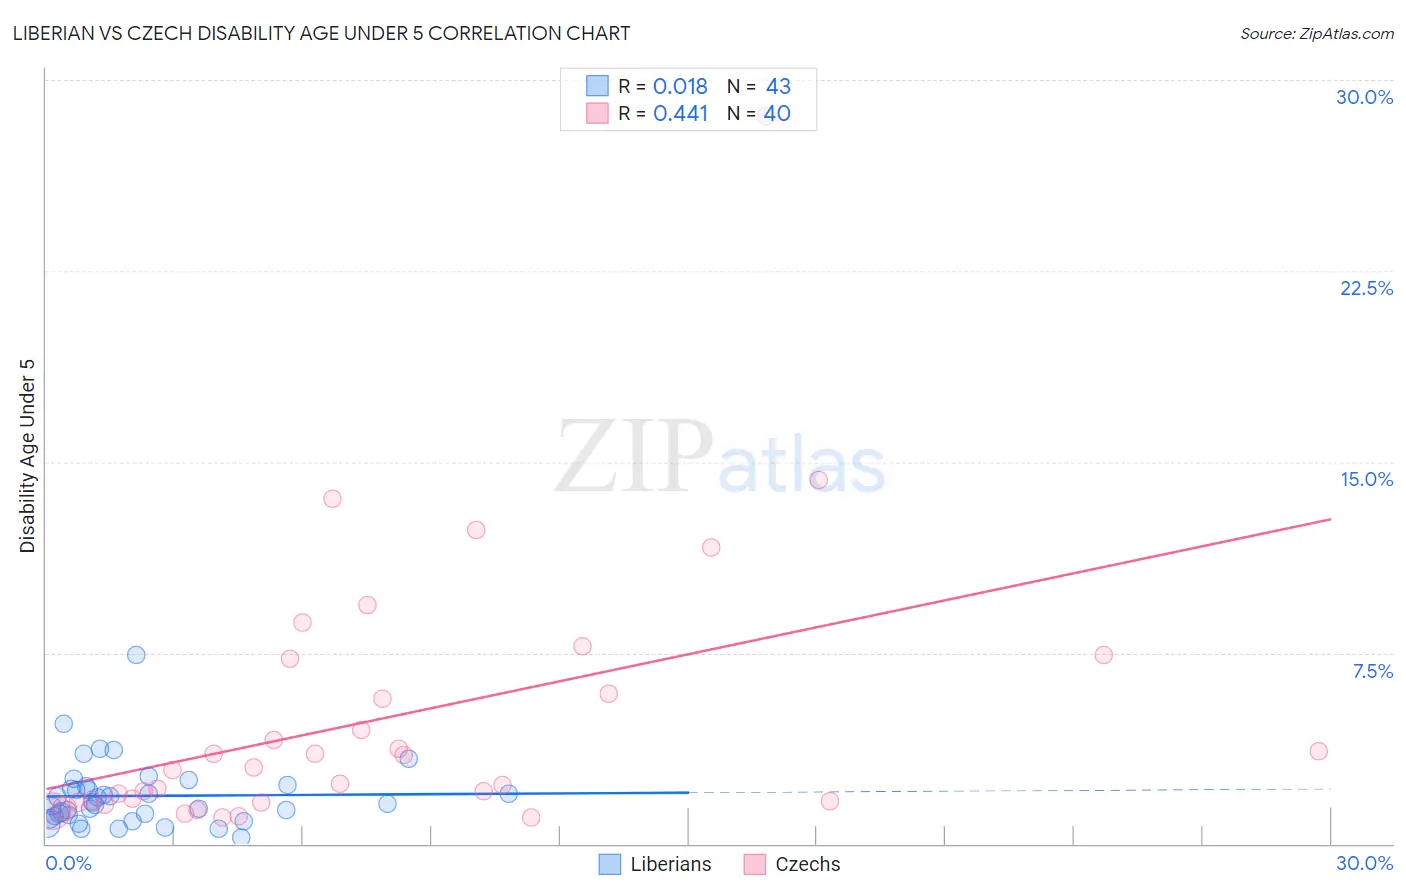
Liberian vs Czech Disability Age Under 5 Correlation Chart
The statistical analysis conducted on geographies consisting of 88,330,984 people shows no correlation between the proportion of Liberians and percentage of population with a disability under the age of 5 in the United States with a correlation coefficient (R) of 0.018 and weighted average of 1.3%. Similarly, the statistical analysis conducted on geographies consisting of 237,038,678 people shows a moderate positive correlation between the proportion of Czechs and percentage of population with a disability under the age of 5 in the United States with a correlation coefficient (R) of 0.441 and weighted average of 1.5%, a difference of 21.8%.
Disability Age Under 5 Correlation Summary
| Measurement | Liberian | Czech |
| Minimum | 0.22% | 1.0% |
| Maximum | 7.4% | 28.6% |
| Range | 7.2% | 27.5% |
| Mean | 1.9% | 4.9% |
| Median | 1.6% | 2.9% |
| Interquartile 25% (IQ1) | 1.1% | 1.7% |
| Interquartile 75% (IQ3) | 2.3% | 6.6% |
| Interquartile Range (IQR) | 1.2% | 4.9% |
| Standard Deviation (Sample) | 1.3% | 5.3% |
| Standard Deviation (Population) | 1.3% | 5.2% |
Similar Demographics by Disability Age Under 5
Demographics Similar to Liberians by Disability Age Under 5
In terms of disability age under 5, the demographic groups most similar to Liberians are Arapaho (1.3%, a difference of 0.020%), Immigrants from Europe (1.3%, a difference of 0.050%), Immigrants from Italy (1.3%, a difference of 0.16%), Romanian (1.3%, a difference of 0.18%), and Immigrants from Poland (1.3%, a difference of 0.20%).
| Demographics | Rating | Rank | Disability Age Under 5 |
| Immigrants | Belgium | 31.4 /100 | #196 | Fair 1.3% |
| Immigrants | Somalia | 31.3 /100 | #197 | Fair 1.3% |
| Immigrants | Norway | 31.1 /100 | #198 | Fair 1.3% |
| Jamaicans | 30.7 /100 | #199 | Fair 1.3% |
| Immigrants | Lithuania | 27.2 /100 | #200 | Fair 1.3% |
| Immigrants | Italy | 25.4 /100 | #201 | Fair 1.3% |
| Arapaho | 24.1 /100 | #202 | Fair 1.3% |
| Liberians | 24.0 /100 | #203 | Fair 1.3% |
| Immigrants | Europe | 23.6 /100 | #204 | Fair 1.3% |
| Romanians | 22.5 /100 | #205 | Fair 1.3% |
| Immigrants | Poland | 22.4 /100 | #206 | Fair 1.3% |
| Nigerians | 21.2 /100 | #207 | Fair 1.3% |
| Mexicans | 20.8 /100 | #208 | Fair 1.3% |
| Bulgarians | 19.5 /100 | #209 | Poor 1.3% |
| Pakistanis | 19.4 /100 | #210 | Poor 1.3% |
Demographics Similar to Czechs by Disability Age Under 5
In terms of disability age under 5, the demographic groups most similar to Czechs are Northern European (1.6%, a difference of 0.10%), Hungarian (1.5%, a difference of 0.13%), Italian (1.6%, a difference of 0.24%), Estonian (1.5%, a difference of 0.26%), and Scandinavian (1.5%, a difference of 0.45%).
| Demographics | Rating | Rank | Disability Age Under 5 |
| Delaware | 0.0 /100 | #283 | Tragic 1.5% |
| Europeans | 0.0 /100 | #284 | Tragic 1.5% |
| Croatians | 0.0 /100 | #285 | Tragic 1.5% |
| Tlingit-Haida | 0.0 /100 | #286 | Tragic 1.5% |
| Scandinavians | 0.0 /100 | #287 | Tragic 1.5% |
| Estonians | 0.0 /100 | #288 | Tragic 1.5% |
| Hungarians | 0.0 /100 | #289 | Tragic 1.5% |
| Czechs | 0.0 /100 | #290 | Tragic 1.5% |
| Northern Europeans | 0.0 /100 | #291 | Tragic 1.6% |
| Italians | 0.0 /100 | #292 | Tragic 1.6% |
| Lithuanians | 0.0 /100 | #293 | Tragic 1.6% |
| Swedes | 0.0 /100 | #294 | Tragic 1.6% |
| Finns | 0.0 /100 | #295 | Tragic 1.6% |
| Poles | 0.0 /100 | #296 | Tragic 1.6% |
| Immigrants | Nonimmigrants | 0.0 /100 | #297 | Tragic 1.6% |