Liberian vs Immigrants from Ethiopia Disability Age Under 5
COMPARE
Liberian
Immigrants from Ethiopia
Disability Age Under 5
Disability Age Under 5 Comparison
Liberians
Immigrants from Ethiopia
1.3%
DISABILITY AGE UNDER 5
24.0/ 100
METRIC RATING
203rd/ 347
METRIC RANK
1.1%
DISABILITY AGE UNDER 5
99.2/ 100
METRIC RATING
61st/ 347
METRIC RANK
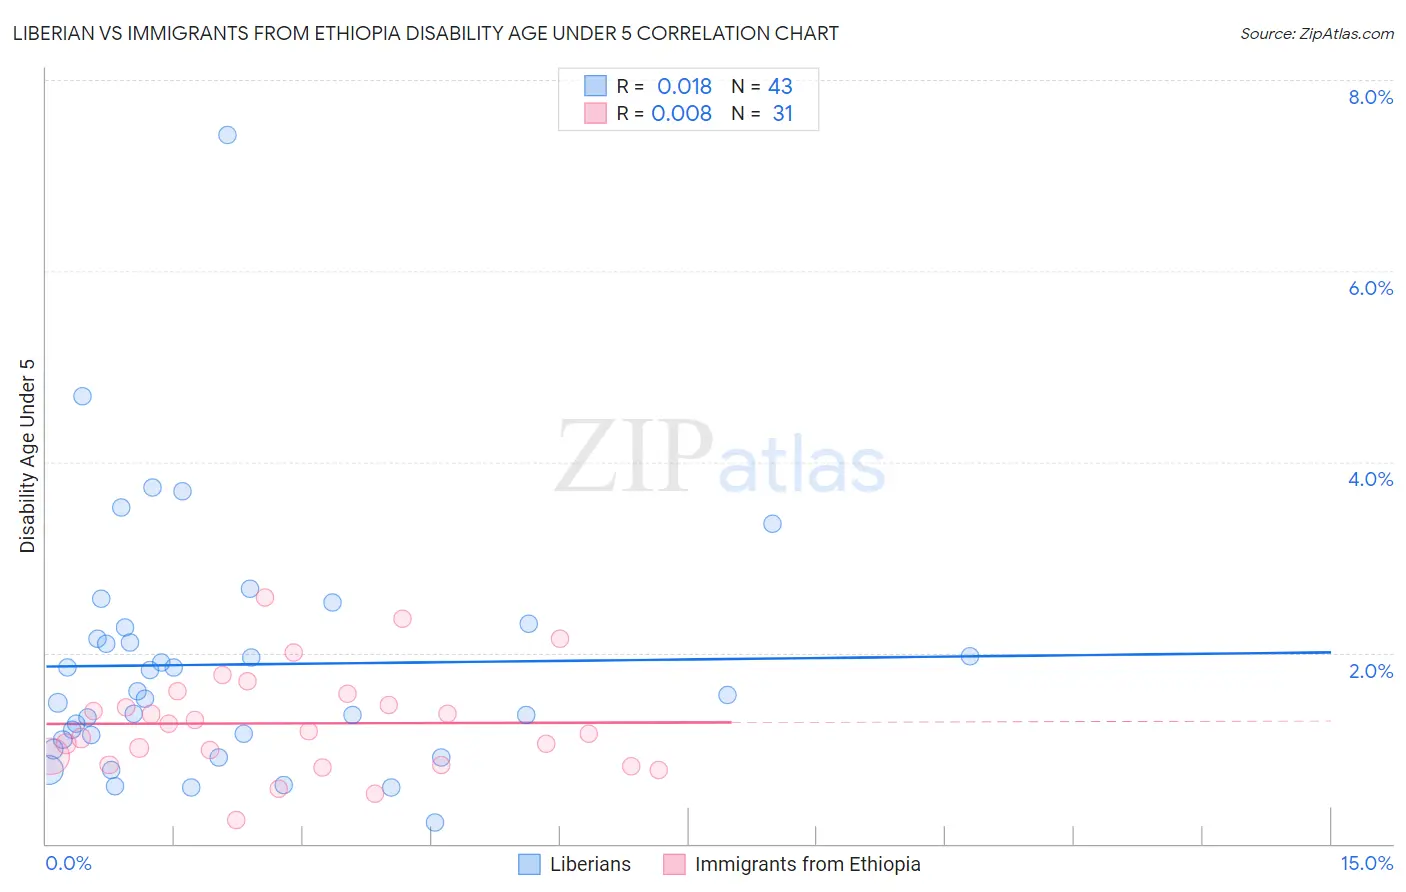
Liberian vs Immigrants from Ethiopia Disability Age Under 5 Correlation Chart
The statistical analysis conducted on geographies consisting of 88,330,984 people shows no correlation between the proportion of Liberians and percentage of population with a disability under the age of 5 in the United States with a correlation coefficient (R) of 0.018 and weighted average of 1.3%. Similarly, the statistical analysis conducted on geographies consisting of 138,545,864 people shows no correlation between the proportion of Immigrants from Ethiopia and percentage of population with a disability under the age of 5 in the United States with a correlation coefficient (R) of 0.008 and weighted average of 1.1%, a difference of 15.0%.
Disability Age Under 5 Correlation Summary
| Measurement | Liberian | Immigrants from Ethiopia |
| Minimum | 0.22% | 0.25% |
| Maximum | 7.4% | 2.6% |
| Range | 7.2% | 2.3% |
| Mean | 1.9% | 1.3% |
| Median | 1.6% | 1.2% |
| Interquartile 25% (IQ1) | 1.1% | 0.83% |
| Interquartile 75% (IQ3) | 2.3% | 1.6% |
| Interquartile Range (IQR) | 1.2% | 0.74% |
| Standard Deviation (Sample) | 1.3% | 0.53% |
| Standard Deviation (Population) | 1.3% | 0.52% |
Similar Demographics by Disability Age Under 5
Demographics Similar to Liberians by Disability Age Under 5
In terms of disability age under 5, the demographic groups most similar to Liberians are Arapaho (1.3%, a difference of 0.020%), Immigrants from Europe (1.3%, a difference of 0.050%), Immigrants from Italy (1.3%, a difference of 0.16%), Romanian (1.3%, a difference of 0.18%), and Immigrants from Poland (1.3%, a difference of 0.20%).
| Demographics | Rating | Rank | Disability Age Under 5 |
| Immigrants | Belgium | 31.4 /100 | #196 | Fair 1.3% |
| Immigrants | Somalia | 31.3 /100 | #197 | Fair 1.3% |
| Immigrants | Norway | 31.1 /100 | #198 | Fair 1.3% |
| Jamaicans | 30.7 /100 | #199 | Fair 1.3% |
| Immigrants | Lithuania | 27.2 /100 | #200 | Fair 1.3% |
| Immigrants | Italy | 25.4 /100 | #201 | Fair 1.3% |
| Arapaho | 24.1 /100 | #202 | Fair 1.3% |
| Liberians | 24.0 /100 | #203 | Fair 1.3% |
| Immigrants | Europe | 23.6 /100 | #204 | Fair 1.3% |
| Romanians | 22.5 /100 | #205 | Fair 1.3% |
| Immigrants | Poland | 22.4 /100 | #206 | Fair 1.3% |
| Nigerians | 21.2 /100 | #207 | Fair 1.3% |
| Mexicans | 20.8 /100 | #208 | Fair 1.3% |
| Bulgarians | 19.5 /100 | #209 | Poor 1.3% |
| Pakistanis | 19.4 /100 | #210 | Poor 1.3% |
Demographics Similar to Immigrants from Ethiopia by Disability Age Under 5
In terms of disability age under 5, the demographic groups most similar to Immigrants from Ethiopia are Immigrants from Switzerland (1.1%, a difference of 0.010%), Immigrants from Western Asia (1.1%, a difference of 0.060%), Immigrants from Vietnam (1.1%, a difference of 0.12%), Egyptian (1.1%, a difference of 0.58%), and Immigrants from Malaysia (1.1%, a difference of 0.82%).
| Demographics | Rating | Rank | Disability Age Under 5 |
| Immigrants | El Salvador | 99.6 /100 | #54 | Exceptional 1.1% |
| Salvadorans | 99.5 /100 | #55 | Exceptional 1.1% |
| Ecuadorians | 99.5 /100 | #56 | Exceptional 1.1% |
| Assyrians/Chaldeans/Syriacs | 99.5 /100 | #57 | Exceptional 1.1% |
| Immigrants | Egypt | 99.4 /100 | #58 | Exceptional 1.1% |
| Immigrants | Malaysia | 99.4 /100 | #59 | Exceptional 1.1% |
| Immigrants | Western Asia | 99.2 /100 | #60 | Exceptional 1.1% |
| Immigrants | Ethiopia | 99.2 /100 | #61 | Exceptional 1.1% |
| Immigrants | Switzerland | 99.2 /100 | #62 | Exceptional 1.1% |
| Immigrants | Vietnam | 99.1 /100 | #63 | Exceptional 1.1% |
| Egyptians | 98.9 /100 | #64 | Exceptional 1.1% |
| Immigrants | Korea | 98.8 /100 | #65 | Exceptional 1.1% |
| Immigrants | Indonesia | 98.7 /100 | #66 | Exceptional 1.1% |
| Immigrants | Belize | 98.7 /100 | #67 | Exceptional 1.1% |
| South Africans | 98.7 /100 | #68 | Exceptional 1.1% |