Liberian vs Lebanese Disability Age Under 5
COMPARE
Liberian
Lebanese
Disability Age Under 5
Disability Age Under 5 Comparison
Liberians
Lebanese
1.3%
DISABILITY AGE UNDER 5
24.0/ 100
METRIC RATING
203rd/ 347
METRIC RANK
1.3%
DISABILITY AGE UNDER 5
5.3/ 100
METRIC RATING
230th/ 347
METRIC RANK
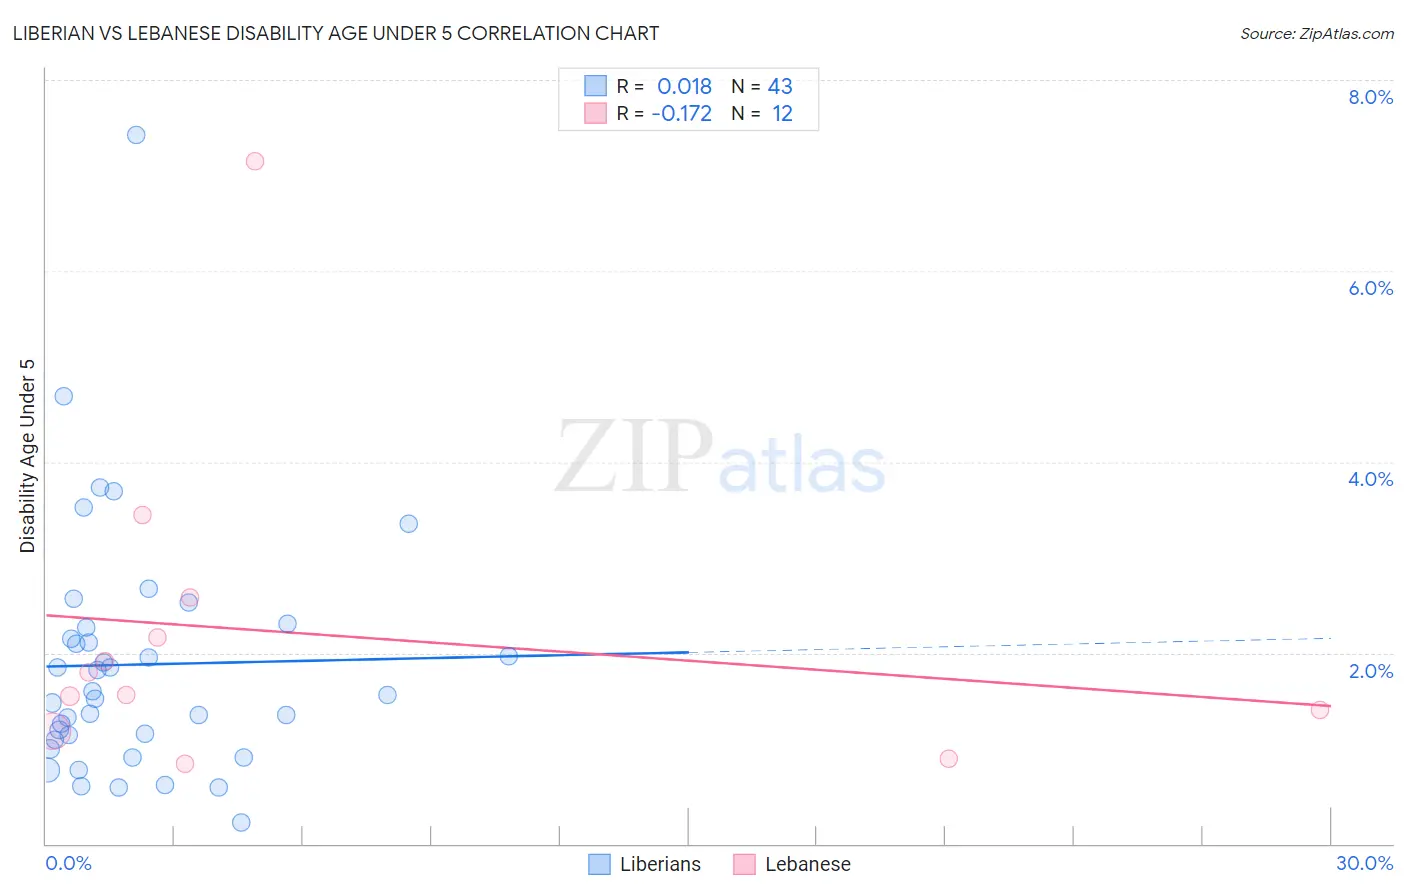
Liberian vs Lebanese Disability Age Under 5 Correlation Chart
The statistical analysis conducted on geographies consisting of 88,330,984 people shows no correlation between the proportion of Liberians and percentage of population with a disability under the age of 5 in the United States with a correlation coefficient (R) of 0.018 and weighted average of 1.3%. Similarly, the statistical analysis conducted on geographies consisting of 215,601,141 people shows a poor negative correlation between the proportion of Lebanese and percentage of population with a disability under the age of 5 in the United States with a correlation coefficient (R) of -0.172 and weighted average of 1.3%, a difference of 3.8%.
Disability Age Under 5 Correlation Summary
| Measurement | Liberian | Lebanese |
| Minimum | 0.22% | 0.84% |
| Maximum | 7.4% | 7.1% |
| Range | 7.2% | 6.3% |
| Mean | 1.9% | 2.2% |
| Median | 1.6% | 1.7% |
| Interquartile 25% (IQ1) | 1.1% | 1.3% |
| Interquartile 75% (IQ3) | 2.3% | 2.4% |
| Interquartile Range (IQR) | 1.2% | 1.1% |
| Standard Deviation (Sample) | 1.3% | 1.7% |
| Standard Deviation (Population) | 1.3% | 1.6% |
Similar Demographics by Disability Age Under 5
Demographics Similar to Liberians by Disability Age Under 5
In terms of disability age under 5, the demographic groups most similar to Liberians are Arapaho (1.3%, a difference of 0.020%), Immigrants from Europe (1.3%, a difference of 0.050%), Immigrants from Italy (1.3%, a difference of 0.16%), Romanian (1.3%, a difference of 0.18%), and Immigrants from Poland (1.3%, a difference of 0.20%).
| Demographics | Rating | Rank | Disability Age Under 5 |
| Immigrants | Belgium | 31.4 /100 | #196 | Fair 1.3% |
| Immigrants | Somalia | 31.3 /100 | #197 | Fair 1.3% |
| Immigrants | Norway | 31.1 /100 | #198 | Fair 1.3% |
| Jamaicans | 30.7 /100 | #199 | Fair 1.3% |
| Immigrants | Lithuania | 27.2 /100 | #200 | Fair 1.3% |
| Immigrants | Italy | 25.4 /100 | #201 | Fair 1.3% |
| Arapaho | 24.1 /100 | #202 | Fair 1.3% |
| Liberians | 24.0 /100 | #203 | Fair 1.3% |
| Immigrants | Europe | 23.6 /100 | #204 | Fair 1.3% |
| Romanians | 22.5 /100 | #205 | Fair 1.3% |
| Immigrants | Poland | 22.4 /100 | #206 | Fair 1.3% |
| Nigerians | 21.2 /100 | #207 | Fair 1.3% |
| Mexicans | 20.8 /100 | #208 | Fair 1.3% |
| Bulgarians | 19.5 /100 | #209 | Poor 1.3% |
| Pakistanis | 19.4 /100 | #210 | Poor 1.3% |
Demographics Similar to Lebanese by Disability Age Under 5
In terms of disability age under 5, the demographic groups most similar to Lebanese are Immigrants from Costa Rica (1.3%, a difference of 0.10%), Immigrants from Northern Europe (1.3%, a difference of 0.25%), Luxembourger (1.3%, a difference of 0.31%), Taiwanese (1.3%, a difference of 0.32%), and French American Indian (1.3%, a difference of 0.38%).
| Demographics | Rating | Rank | Disability Age Under 5 |
| Hispanics or Latinos | 7.7 /100 | #223 | Tragic 1.3% |
| Latvians | 7.1 /100 | #224 | Tragic 1.3% |
| Panamanians | 7.1 /100 | #225 | Tragic 1.3% |
| Bahamians | 7.1 /100 | #226 | Tragic 1.3% |
| Taiwanese | 6.1 /100 | #227 | Tragic 1.3% |
| Luxembourgers | 6.1 /100 | #228 | Tragic 1.3% |
| Immigrants | Costa Rica | 5.5 /100 | #229 | Tragic 1.3% |
| Lebanese | 5.3 /100 | #230 | Tragic 1.3% |
| Immigrants | Northern Europe | 4.7 /100 | #231 | Tragic 1.3% |
| French American Indians | 4.5 /100 | #232 | Tragic 1.3% |
| Tongans | 4.2 /100 | #233 | Tragic 1.3% |
| Pueblo | 3.8 /100 | #234 | Tragic 1.3% |
| Central American Indians | 3.6 /100 | #235 | Tragic 1.3% |
| South American Indians | 3.3 /100 | #236 | Tragic 1.3% |
| Basques | 3.0 /100 | #237 | Tragic 1.3% |