Liberian vs Immigrants from Greece Disability Age Under 5
COMPARE
Liberian
Immigrants from Greece
Disability Age Under 5
Disability Age Under 5 Comparison
Liberians
Immigrants from Greece
1.3%
DISABILITY AGE UNDER 5
24.0/ 100
METRIC RATING
203rd/ 347
METRIC RANK
1.3%
DISABILITY AGE UNDER 5
19.1/ 100
METRIC RATING
211th/ 347
METRIC RANK
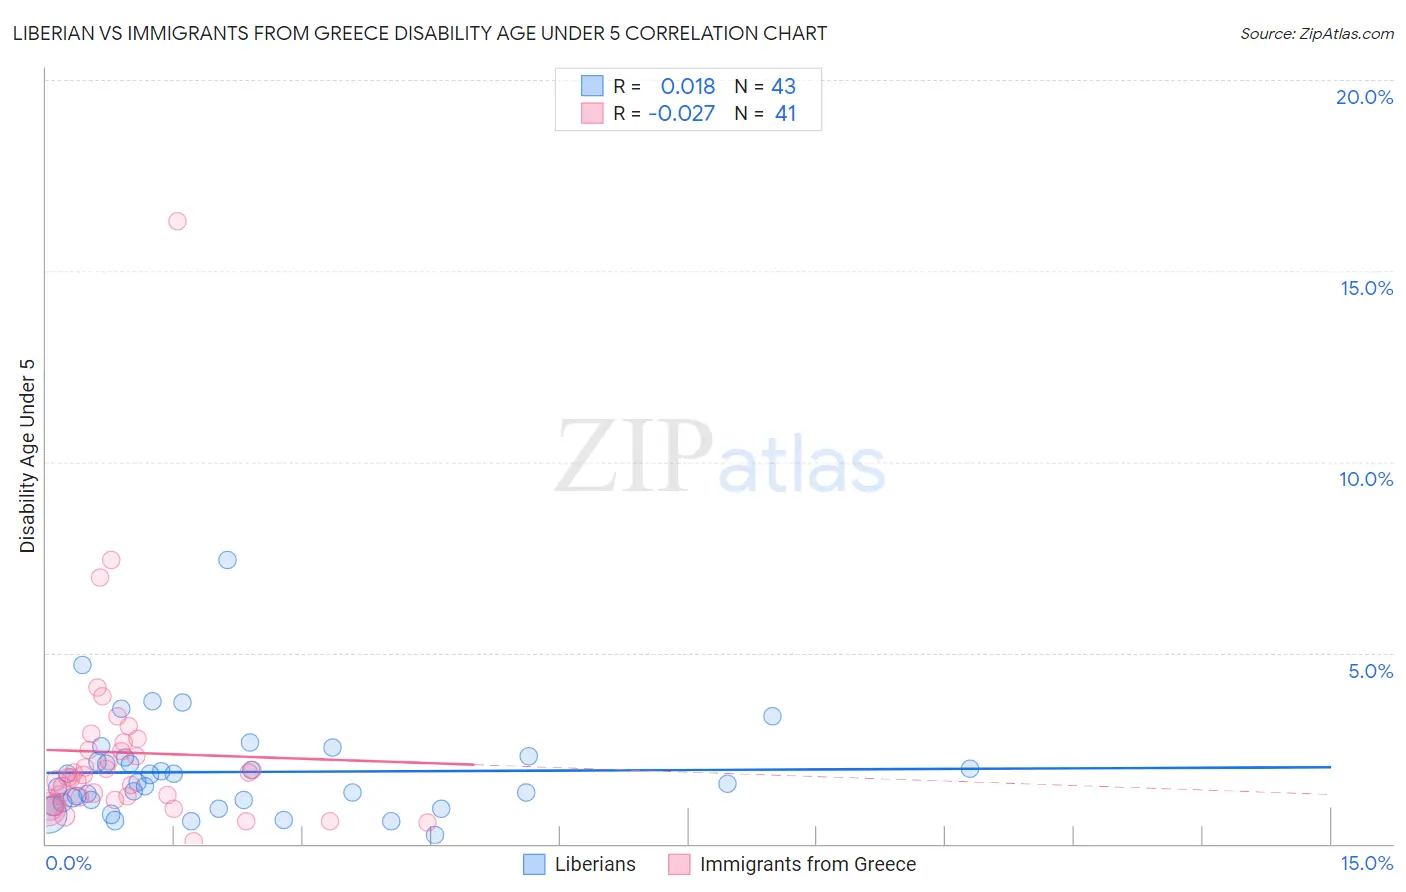
Liberian vs Immigrants from Greece Disability Age Under 5 Correlation Chart
The statistical analysis conducted on geographies consisting of 88,330,984 people shows no correlation between the proportion of Liberians and percentage of population with a disability under the age of 5 in the United States with a correlation coefficient (R) of 0.018 and weighted average of 1.3%. Similarly, the statistical analysis conducted on geographies consisting of 132,613,079 people shows no correlation between the proportion of Immigrants from Greece and percentage of population with a disability under the age of 5 in the United States with a correlation coefficient (R) of -0.027 and weighted average of 1.3%, a difference of 0.64%.
Disability Age Under 5 Correlation Summary
| Measurement | Liberian | Immigrants from Greece |
| Minimum | 0.22% | 0.058% |
| Maximum | 7.4% | 16.3% |
| Range | 7.2% | 16.2% |
| Mean | 1.9% | 2.4% |
| Median | 1.6% | 1.7% |
| Interquartile 25% (IQ1) | 1.1% | 1.2% |
| Interquartile 75% (IQ3) | 2.3% | 2.6% |
| Interquartile Range (IQR) | 1.2% | 1.4% |
| Standard Deviation (Sample) | 1.3% | 2.7% |
| Standard Deviation (Population) | 1.3% | 2.6% |
Demographics Similar to Liberians and Immigrants from Greece by Disability Age Under 5
In terms of disability age under 5, the demographic groups most similar to Liberians are Arapaho (1.3%, a difference of 0.020%), Immigrants from Europe (1.3%, a difference of 0.050%), Immigrants from Italy (1.3%, a difference of 0.16%), Romanian (1.3%, a difference of 0.18%), and Immigrants from Poland (1.3%, a difference of 0.20%). Similarly, the demographic groups most similar to Immigrants from Greece are Pakistani (1.3%, a difference of 0.040%), Chilean (1.3%, a difference of 0.040%), Bulgarian (1.3%, a difference of 0.050%), Immigrants from Sudan (1.3%, a difference of 0.060%), and Mexican (1.3%, a difference of 0.23%).
| Demographics | Rating | Rank | Disability Age Under 5 |
| Immigrants | Somalia | 31.3 /100 | #197 | Fair 1.3% |
| Immigrants | Norway | 31.1 /100 | #198 | Fair 1.3% |
| Jamaicans | 30.7 /100 | #199 | Fair 1.3% |
| Immigrants | Lithuania | 27.2 /100 | #200 | Fair 1.3% |
| Immigrants | Italy | 25.4 /100 | #201 | Fair 1.3% |
| Arapaho | 24.1 /100 | #202 | Fair 1.3% |
| Liberians | 24.0 /100 | #203 | Fair 1.3% |
| Immigrants | Europe | 23.6 /100 | #204 | Fair 1.3% |
| Romanians | 22.5 /100 | #205 | Fair 1.3% |
| Immigrants | Poland | 22.4 /100 | #206 | Fair 1.3% |
| Nigerians | 21.2 /100 | #207 | Fair 1.3% |
| Mexicans | 20.8 /100 | #208 | Fair 1.3% |
| Bulgarians | 19.5 /100 | #209 | Poor 1.3% |
| Pakistanis | 19.4 /100 | #210 | Poor 1.3% |
| Immigrants | Greece | 19.1 /100 | #211 | Poor 1.3% |
| Chileans | 18.8 /100 | #212 | Poor 1.3% |
| Immigrants | Sudan | 18.7 /100 | #213 | Poor 1.3% |
| Immigrants | Chile | 17.2 /100 | #214 | Poor 1.3% |
| Syrians | 16.1 /100 | #215 | Poor 1.3% |
| Bangladeshis | 15.5 /100 | #216 | Poor 1.3% |
| Cypriots | 14.9 /100 | #217 | Poor 1.3% |