Liberian vs Czech 9th Grade
COMPARE
Liberian
Czech
9th Grade
9th Grade Comparison
Liberians
Czechs
94.8%
9TH GRADE
37.4/ 100
METRIC RATING
185th/ 347
METRIC RANK
96.4%
9TH GRADE
100.0/ 100
METRIC RATING
23rd/ 347
METRIC RANK
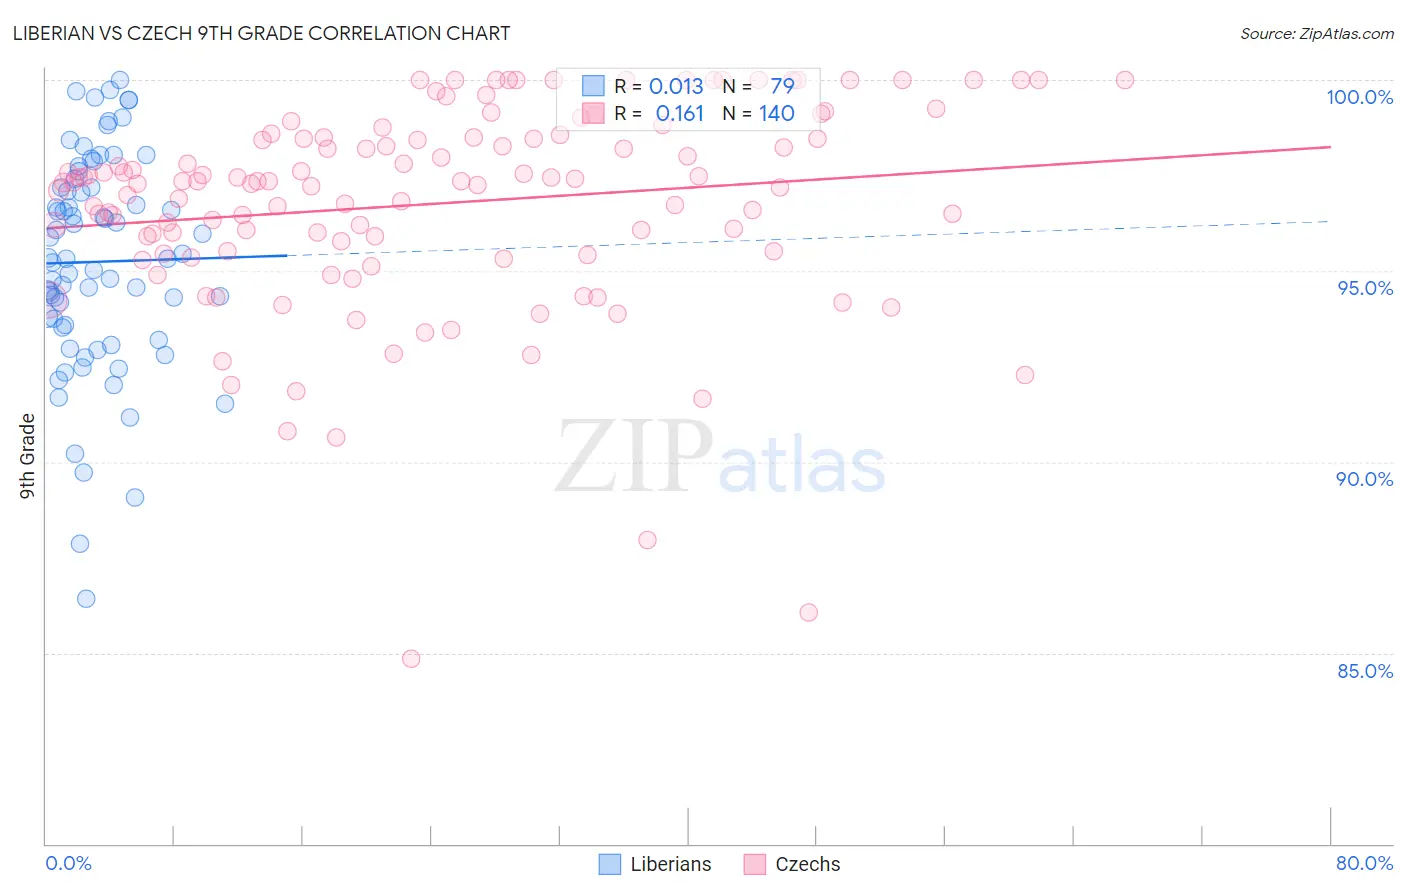
Liberian vs Czech 9th Grade Correlation Chart
The statistical analysis conducted on geographies consisting of 118,101,800 people shows no correlation between the proportion of Liberians and percentage of population with at least 9th grade education in the United States with a correlation coefficient (R) of 0.013 and weighted average of 94.8%. Similarly, the statistical analysis conducted on geographies consisting of 484,814,005 people shows a poor positive correlation between the proportion of Czechs and percentage of population with at least 9th grade education in the United States with a correlation coefficient (R) of 0.161 and weighted average of 96.4%, a difference of 1.7%.
9th Grade Correlation Summary
| Measurement | Liberian | Czech |
| Minimum | 86.4% | 84.8% |
| Maximum | 100.0% | 100.0% |
| Range | 13.6% | 15.2% |
| Mean | 95.2% | 96.8% |
| Median | 95.3% | 97.3% |
| Interquartile 25% (IQ1) | 93.5% | 95.5% |
| Interquartile 75% (IQ3) | 97.2% | 98.5% |
| Interquartile Range (IQR) | 3.7% | 3.0% |
| Standard Deviation (Sample) | 2.8% | 2.7% |
| Standard Deviation (Population) | 2.8% | 2.7% |
Similar Demographics by 9th Grade
Demographics Similar to Liberians by 9th Grade
In terms of 9th grade, the demographic groups most similar to Liberians are Argentinean (94.8%, a difference of 0.0%), Hopi (94.8%, a difference of 0.0%), Immigrants from Nepal (94.8%, a difference of 0.020%), Guamanian/Chamorro (94.8%, a difference of 0.020%), and Immigrants from Albania (94.8%, a difference of 0.020%).
| Demographics | Rating | Rank | 9th Grade |
| Immigrants | Poland | 46.7 /100 | #178 | Average 94.9% |
| Immigrants | Venezuela | 46.5 /100 | #179 | Average 94.9% |
| Immigrants | Uganda | 43.1 /100 | #180 | Average 94.8% |
| Sierra Leoneans | 42.7 /100 | #181 | Average 94.8% |
| Seminole | 42.5 /100 | #182 | Average 94.8% |
| Immigrants | Nepal | 39.7 /100 | #183 | Fair 94.8% |
| Argentineans | 37.6 /100 | #184 | Fair 94.8% |
| Liberians | 37.4 /100 | #185 | Fair 94.8% |
| Hopi | 37.1 /100 | #186 | Fair 94.8% |
| Guamanians/Chamorros | 35.5 /100 | #187 | Fair 94.8% |
| Immigrants | Albania | 34.5 /100 | #188 | Fair 94.8% |
| Immigrants | Argentina | 34.4 /100 | #189 | Fair 94.8% |
| Sudanese | 32.7 /100 | #190 | Fair 94.7% |
| Assyrians/Chaldeans/Syriacs | 32.0 /100 | #191 | Fair 94.7% |
| Immigrants | Northern Africa | 30.7 /100 | #192 | Fair 94.7% |
Demographics Similar to Czechs by 9th Grade
In terms of 9th grade, the demographic groups most similar to Czechs are European (96.4%, a difference of 0.010%), Alaskan Athabascan (96.4%, a difference of 0.020%), Latvian (96.4%, a difference of 0.030%), Welsh (96.4%, a difference of 0.040%), and Italian (96.4%, a difference of 0.040%).
| Demographics | Rating | Rank | 9th Grade |
| Croatians | 100.0 /100 | #16 | Exceptional 96.5% |
| Dutch | 100.0 /100 | #17 | Exceptional 96.5% |
| Scandinavians | 100.0 /100 | #18 | Exceptional 96.5% |
| Welsh | 100.0 /100 | #19 | Exceptional 96.4% |
| Italians | 100.0 /100 | #20 | Exceptional 96.4% |
| Alaskan Athabascans | 100.0 /100 | #21 | Exceptional 96.4% |
| Europeans | 100.0 /100 | #22 | Exceptional 96.4% |
| Czechs | 100.0 /100 | #23 | Exceptional 96.4% |
| Latvians | 100.0 /100 | #24 | Exceptional 96.4% |
| French | 100.0 /100 | #25 | Exceptional 96.3% |
| French Canadians | 100.0 /100 | #26 | Exceptional 96.3% |
| Scotch-Irish | 100.0 /100 | #27 | Exceptional 96.3% |
| Eastern Europeans | 100.0 /100 | #28 | Exceptional 96.3% |
| Chinese | 100.0 /100 | #29 | Exceptional 96.3% |
| Maltese | 100.0 /100 | #30 | Exceptional 96.3% |