Lebanese vs Bolivian Male Disability
COMPARE
Lebanese
Bolivian
Male Disability
Male Disability Comparison
Lebanese
Bolivians
11.5%
MALE DISABILITY
15.4/ 100
METRIC RATING
199th/ 347
METRIC RANK
9.6%
MALE DISABILITY
100.0/ 100
METRIC RATING
12th/ 347
METRIC RANK
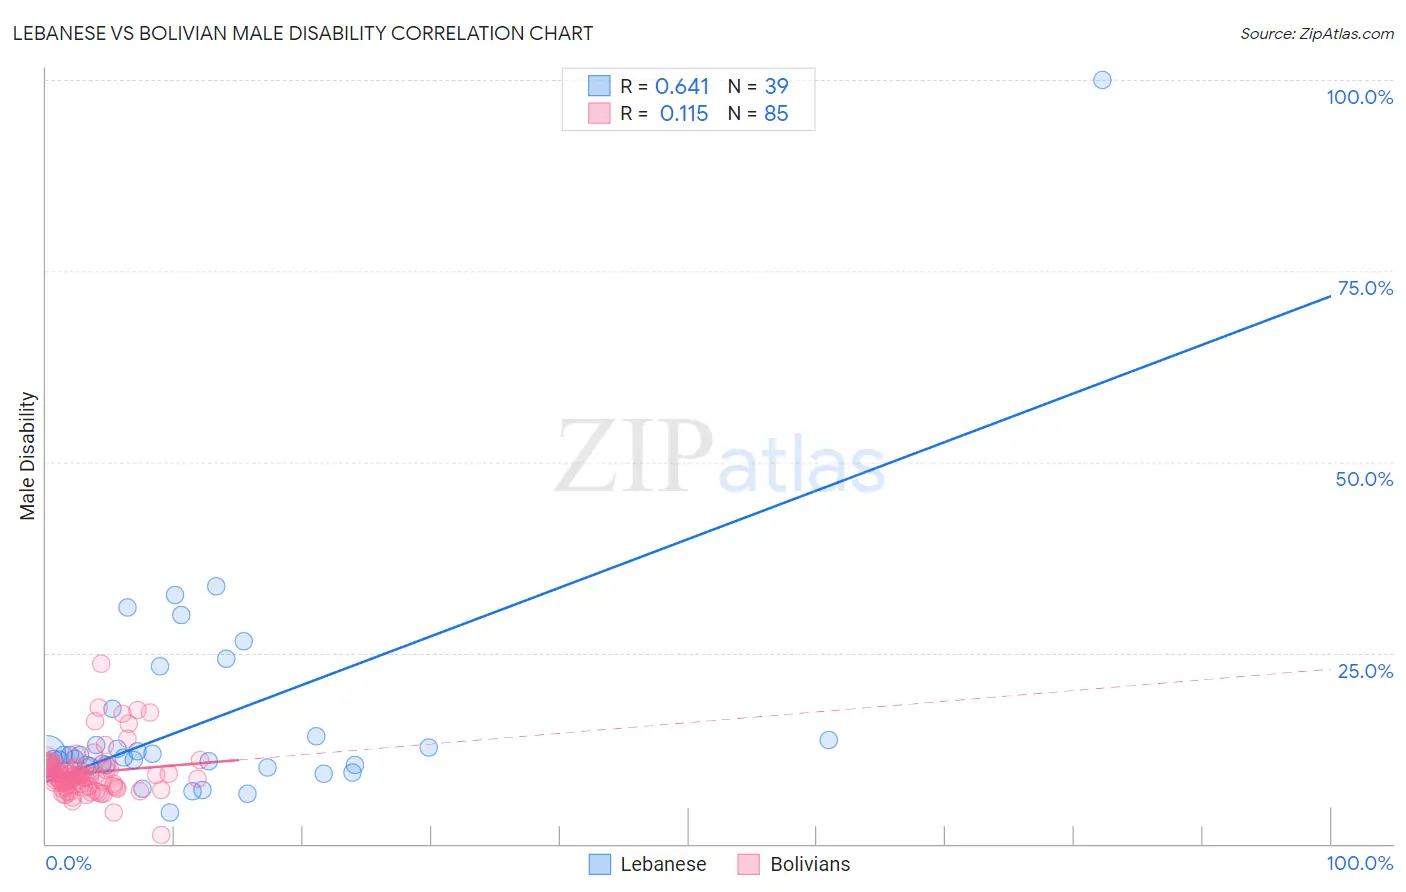
Lebanese vs Bolivian Male Disability Correlation Chart
The statistical analysis conducted on geographies consisting of 401,575,974 people shows a significant positive correlation between the proportion of Lebanese and percentage of males with a disability in the United States with a correlation coefficient (R) of 0.641 and weighted average of 11.5%. Similarly, the statistical analysis conducted on geographies consisting of 184,652,899 people shows a poor positive correlation between the proportion of Bolivians and percentage of males with a disability in the United States with a correlation coefficient (R) of 0.115 and weighted average of 9.6%, a difference of 19.1%.
Male Disability Correlation Summary
| Measurement | Lebanese | Bolivian |
| Minimum | 4.0% | 1.2% |
| Maximum | 100.0% | 23.5% |
| Range | 96.0% | 22.3% |
| Mean | 16.2% | 9.3% |
| Median | 11.6% | 8.9% |
| Interquartile 25% (IQ1) | 10.2% | 7.4% |
| Interquartile 75% (IQ3) | 14.1% | 10.1% |
| Interquartile Range (IQR) | 3.9% | 2.7% |
| Standard Deviation (Sample) | 15.7% | 3.2% |
| Standard Deviation (Population) | 15.5% | 3.2% |
Similar Demographics by Male Disability
Demographics Similar to Lebanese by Male Disability
In terms of male disability, the demographic groups most similar to Lebanese are Immigrants from Jamaica (11.5%, a difference of 0.090%), Somali (11.4%, a difference of 0.27%), Immigrants from Iraq (11.5%, a difference of 0.27%), Immigrants from Panama (11.5%, a difference of 0.27%), and West Indian (11.4%, a difference of 0.29%).
| Demographics | Rating | Rank | Male Disability |
| Assyrians/Chaldeans/Syriacs | 23.2 /100 | #192 | Fair 11.4% |
| Greeks | 22.2 /100 | #193 | Fair 11.4% |
| Belizeans | 21.2 /100 | #194 | Fair 11.4% |
| Immigrants | Oceania | 20.9 /100 | #195 | Fair 11.4% |
| West Indians | 18.4 /100 | #196 | Poor 11.4% |
| Somalis | 18.2 /100 | #197 | Poor 11.4% |
| Immigrants | Jamaica | 16.3 /100 | #198 | Poor 11.5% |
| Lebanese | 15.4 /100 | #199 | Poor 11.5% |
| Immigrants | Iraq | 13.0 /100 | #200 | Poor 11.5% |
| Immigrants | Panama | 13.0 /100 | #201 | Poor 11.5% |
| Immigrants | Mexico | 12.6 /100 | #202 | Poor 11.5% |
| Jamaicans | 10.9 /100 | #203 | Poor 11.5% |
| Immigrants | Cambodia | 10.8 /100 | #204 | Poor 11.5% |
| Serbians | 10.7 /100 | #205 | Poor 11.5% |
| Ukrainians | 10.6 /100 | #206 | Poor 11.5% |
Demographics Similar to Bolivians by Male Disability
In terms of male disability, the demographic groups most similar to Bolivians are Iranian (9.7%, a difference of 0.23%), Immigrants from Eastern Asia (9.6%, a difference of 0.24%), Immigrants from Iran (9.7%, a difference of 0.33%), Indian (Asian) (9.7%, a difference of 0.78%), and Immigrants from Israel (9.6%, a difference of 0.79%).
| Demographics | Rating | Rank | Male Disability |
| Immigrants | Hong Kong | 100.0 /100 | #5 | Exceptional 9.4% |
| Immigrants | South Central Asia | 100.0 /100 | #6 | Exceptional 9.4% |
| Immigrants | Bolivia | 100.0 /100 | #7 | Exceptional 9.5% |
| Immigrants | China | 100.0 /100 | #8 | Exceptional 9.5% |
| Immigrants | Singapore | 100.0 /100 | #9 | Exceptional 9.5% |
| Immigrants | Israel | 100.0 /100 | #10 | Exceptional 9.6% |
| Immigrants | Eastern Asia | 100.0 /100 | #11 | Exceptional 9.6% |
| Bolivians | 100.0 /100 | #12 | Exceptional 9.6% |
| Iranians | 100.0 /100 | #13 | Exceptional 9.7% |
| Immigrants | Iran | 100.0 /100 | #14 | Exceptional 9.7% |
| Indians (Asian) | 100.0 /100 | #15 | Exceptional 9.7% |
| Okinawans | 100.0 /100 | #16 | Exceptional 9.8% |
| Immigrants | Korea | 100.0 /100 | #17 | Exceptional 9.8% |
| Immigrants | Pakistan | 100.0 /100 | #18 | Exceptional 9.8% |
| Immigrants | Sri Lanka | 100.0 /100 | #19 | Exceptional 10.0% |