Latvian vs Immigrants from Czechoslovakia 1 or more Vehicles in Household
COMPARE
Latvian
Immigrants from Czechoslovakia
1 or more Vehicles in Household
1 or more Vehicles in Household Comparison
Latvians
Immigrants from Czechoslovakia
90.3%
1 OR MORE VEHICLES IN HOUSEHOLD
86.3/ 100
METRIC RATING
137th/ 347
METRIC RANK
88.3%
1 OR MORE VEHICLES IN HOUSEHOLD
1.9/ 100
METRIC RATING
245th/ 347
METRIC RANK
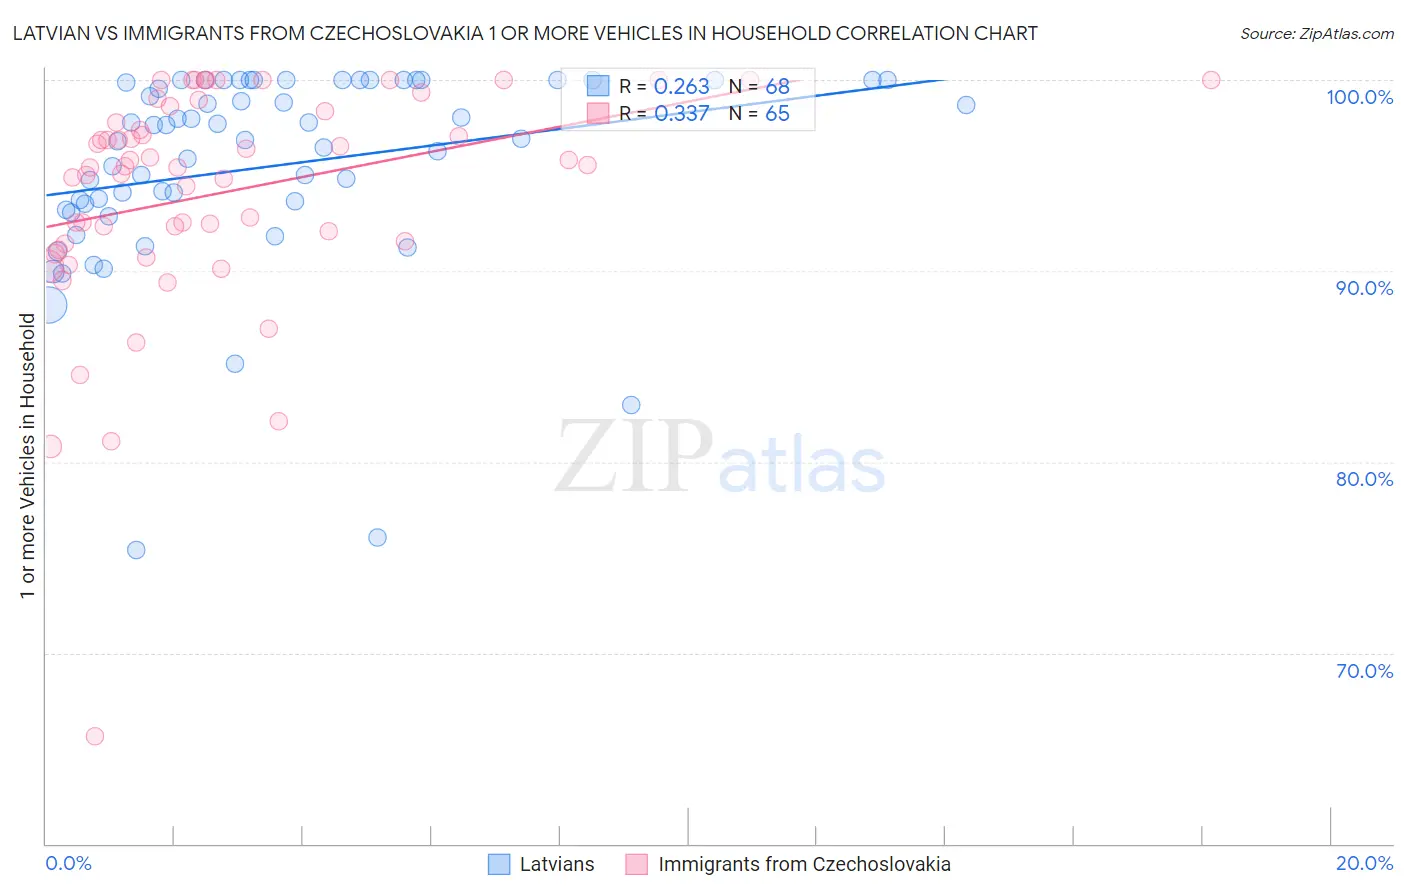
Latvian vs Immigrants from Czechoslovakia 1 or more Vehicles in Household Correlation Chart
The statistical analysis conducted on geographies consisting of 220,666,032 people shows a weak positive correlation between the proportion of Latvians and percentage of households with 1 or more vehicles available in the United States with a correlation coefficient (R) of 0.263 and weighted average of 90.3%. Similarly, the statistical analysis conducted on geographies consisting of 195,451,369 people shows a mild positive correlation between the proportion of Immigrants from Czechoslovakia and percentage of households with 1 or more vehicles available in the United States with a correlation coefficient (R) of 0.337 and weighted average of 88.3%, a difference of 2.3%.
1 or more Vehicles in Household Correlation Summary
| Measurement | Latvian | Immigrants from Czechoslovakia |
| Minimum | 75.4% | 65.6% |
| Maximum | 100.0% | 100.0% |
| Range | 24.6% | 34.4% |
| Mean | 95.5% | 94.1% |
| Median | 96.9% | 95.5% |
| Interquartile 25% (IQ1) | 93.4% | 91.5% |
| Interquartile 75% (IQ3) | 100.0% | 98.5% |
| Interquartile Range (IQR) | 6.6% | 7.0% |
| Standard Deviation (Sample) | 5.3% | 6.0% |
| Standard Deviation (Population) | 5.2% | 5.9% |
Similar Demographics by 1 or more Vehicles in Household
Demographics Similar to Latvians by 1 or more Vehicles in Household
In terms of 1 or more vehicles in household, the demographic groups most similar to Latvians are Syrian (90.3%, a difference of 0.0%), Hungarian (90.3%, a difference of 0.010%), Kenyan (90.4%, a difference of 0.020%), Immigrants from Oceania (90.4%, a difference of 0.020%), and Estonian (90.3%, a difference of 0.020%).
| Demographics | Rating | Rank | 1 or more Vehicles in Household |
| Nicaraguans | 88.8 /100 | #130 | Excellent 90.4% |
| Immigrants | Kenya | 88.5 /100 | #131 | Excellent 90.4% |
| Immigrants | South Africa | 88.1 /100 | #132 | Excellent 90.4% |
| Immigrants | Syria | 87.5 /100 | #133 | Excellent 90.4% |
| Kenyans | 87.0 /100 | #134 | Excellent 90.4% |
| Immigrants | Oceania | 86.9 /100 | #135 | Excellent 90.4% |
| Hungarians | 86.5 /100 | #136 | Excellent 90.3% |
| Latvians | 86.3 /100 | #137 | Excellent 90.3% |
| Syrians | 86.3 /100 | #138 | Excellent 90.3% |
| Estonians | 85.6 /100 | #139 | Excellent 90.3% |
| Sudanese | 85.2 /100 | #140 | Excellent 90.3% |
| Immigrants | Moldova | 83.1 /100 | #141 | Excellent 90.2% |
| Immigrants | Lithuania | 83.0 /100 | #142 | Excellent 90.2% |
| Immigrants | Bahamas | 81.5 /100 | #143 | Excellent 90.2% |
| Immigrants | Zimbabwe | 81.5 /100 | #144 | Excellent 90.2% |
Demographics Similar to Immigrants from Czechoslovakia by 1 or more Vehicles in Household
In terms of 1 or more vehicles in household, the demographic groups most similar to Immigrants from Czechoslovakia are Immigrants from Portugal (88.3%, a difference of 0.010%), Menominee (88.3%, a difference of 0.010%), Immigrants from Belgium (88.4%, a difference of 0.040%), Immigrants from Honduras (88.3%, a difference of 0.050%), and Immigrants from Nigeria (88.2%, a difference of 0.090%).
| Demographics | Rating | Rank | 1 or more Vehicles in Household |
| Immigrants | Somalia | 4.2 /100 | #238 | Tragic 88.6% |
| Kiowa | 3.8 /100 | #239 | Tragic 88.6% |
| Eastern Europeans | 3.0 /100 | #240 | Tragic 88.5% |
| Taiwanese | 2.6 /100 | #241 | Tragic 88.4% |
| Turks | 2.5 /100 | #242 | Tragic 88.4% |
| Immigrants | Belgium | 2.1 /100 | #243 | Tragic 88.4% |
| Immigrants | Portugal | 2.0 /100 | #244 | Tragic 88.3% |
| Immigrants | Czechoslovakia | 1.9 /100 | #245 | Tragic 88.3% |
| Menominee | 1.9 /100 | #246 | Tragic 88.3% |
| Immigrants | Honduras | 1.7 /100 | #247 | Tragic 88.3% |
| Immigrants | Nigeria | 1.5 /100 | #248 | Tragic 88.2% |
| Blacks/African Americans | 1.4 /100 | #249 | Tragic 88.2% |
| Egyptians | 1.2 /100 | #250 | Tragic 88.2% |
| Immigrants | Serbia | 1.2 /100 | #251 | Tragic 88.2% |
| Immigrants | Uruguay | 1.1 /100 | #252 | Tragic 88.1% |