Spanish vs Immigrants from Czechoslovakia Ambulatory Disability
COMPARE
Spanish
Immigrants from Czechoslovakia
Ambulatory Disability
Ambulatory Disability Comparison
Spanish
Immigrants from Czechoslovakia
6.6%
AMBULATORY DISABILITY
0.2/ 100
METRIC RATING
268th/ 347
METRIC RANK
5.8%
AMBULATORY DISABILITY
97.4/ 100
METRIC RATING
105th/ 347
METRIC RANK
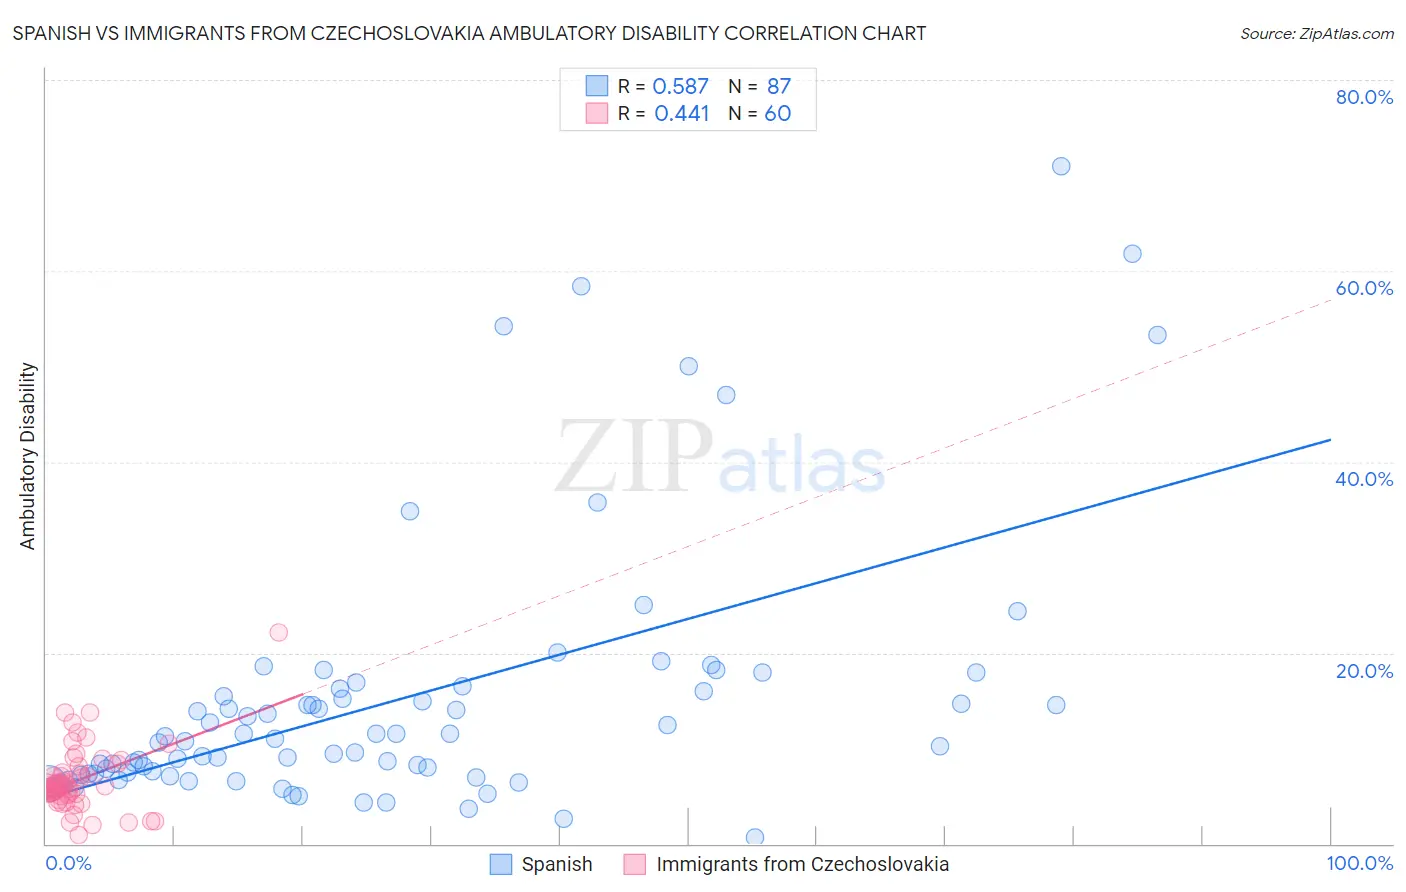
Spanish vs Immigrants from Czechoslovakia Ambulatory Disability Correlation Chart
The statistical analysis conducted on geographies consisting of 421,992,199 people shows a substantial positive correlation between the proportion of Spanish and percentage of population with ambulatory disability in the United States with a correlation coefficient (R) of 0.587 and weighted average of 6.6%. Similarly, the statistical analysis conducted on geographies consisting of 195,441,857 people shows a moderate positive correlation between the proportion of Immigrants from Czechoslovakia and percentage of population with ambulatory disability in the United States with a correlation coefficient (R) of 0.441 and weighted average of 5.8%, a difference of 13.8%.
Ambulatory Disability Correlation Summary
| Measurement | Spanish | Immigrants from Czechoslovakia |
| Minimum | 0.68% | 0.95% |
| Maximum | 71.0% | 22.2% |
| Range | 70.3% | 21.2% |
| Mean | 15.1% | 6.6% |
| Median | 11.0% | 5.8% |
| Interquartile 25% (IQ1) | 7.3% | 5.2% |
| Interquartile 75% (IQ3) | 16.2% | 7.4% |
| Interquartile Range (IQR) | 8.9% | 2.2% |
| Standard Deviation (Sample) | 13.9% | 3.4% |
| Standard Deviation (Population) | 13.8% | 3.4% |
Similar Demographics by Ambulatory Disability
Demographics Similar to Spanish by Ambulatory Disability
In terms of ambulatory disability, the demographic groups most similar to Spanish are Trinidadian and Tobagonian (6.6%, a difference of 0.020%), Guyanese (6.6%, a difference of 0.14%), Bahamian (6.6%, a difference of 0.26%), French (6.6%, a difference of 0.31%), and Nepalese (6.6%, a difference of 0.33%).
| Demographics | Rating | Rank | Ambulatory Disability |
| Irish | 0.4 /100 | #261 | Tragic 6.6% |
| English | 0.4 /100 | #262 | Tragic 6.6% |
| Hmong | 0.3 /100 | #263 | Tragic 6.6% |
| Nepalese | 0.2 /100 | #264 | Tragic 6.6% |
| Bahamians | 0.2 /100 | #265 | Tragic 6.6% |
| Guyanese | 0.2 /100 | #266 | Tragic 6.6% |
| Trinidadians and Tobagonians | 0.2 /100 | #267 | Tragic 6.6% |
| Spanish | 0.2 /100 | #268 | Tragic 6.6% |
| French | 0.1 /100 | #269 | Tragic 6.6% |
| Slovaks | 0.1 /100 | #270 | Tragic 6.7% |
| Immigrants | Trinidad and Tobago | 0.1 /100 | #271 | Tragic 6.7% |
| French Canadians | 0.1 /100 | #272 | Tragic 6.7% |
| Whites/Caucasians | 0.1 /100 | #273 | Tragic 6.7% |
| Sioux | 0.1 /100 | #274 | Tragic 6.7% |
| Immigrants | Guyana | 0.1 /100 | #275 | Tragic 6.7% |
Demographics Similar to Immigrants from Czechoslovakia by Ambulatory Disability
In terms of ambulatory disability, the demographic groups most similar to Immigrants from Czechoslovakia are Immigrants from Morocco (5.8%, a difference of 0.070%), New Zealander (5.8%, a difference of 0.11%), Uruguayan (5.8%, a difference of 0.12%), Colombian (5.8%, a difference of 0.14%), and Immigrants from Netherlands (5.8%, a difference of 0.15%).
| Demographics | Rating | Rank | Ambulatory Disability |
| Immigrants | Lebanon | 98.3 /100 | #98 | Exceptional 5.8% |
| Immigrants | Northern Europe | 98.2 /100 | #99 | Exceptional 5.8% |
| Immigrants | Serbia | 97.9 /100 | #100 | Exceptional 5.8% |
| Immigrants | South America | 97.9 /100 | #101 | Exceptional 5.8% |
| Immigrants | Kenya | 97.8 /100 | #102 | Exceptional 5.8% |
| Immigrants | Romania | 97.7 /100 | #103 | Exceptional 5.8% |
| New Zealanders | 97.6 /100 | #104 | Exceptional 5.8% |
| Immigrants | Czechoslovakia | 97.4 /100 | #105 | Exceptional 5.8% |
| Immigrants | Morocco | 97.3 /100 | #106 | Exceptional 5.8% |
| Uruguayans | 97.2 /100 | #107 | Exceptional 5.8% |
| Colombians | 97.2 /100 | #108 | Exceptional 5.8% |
| Immigrants | Netherlands | 97.1 /100 | #109 | Exceptional 5.8% |
| Immigrants | Colombia | 96.7 /100 | #110 | Exceptional 5.8% |
| Danes | 96.6 /100 | #111 | Exceptional 5.8% |
| South Africans | 96.3 /100 | #112 | Exceptional 5.9% |