Afghan vs Immigrants from Czechoslovakia Ambulatory Disability
COMPARE
Afghan
Immigrants from Czechoslovakia
Ambulatory Disability
Ambulatory Disability Comparison
Afghans
Immigrants from Czechoslovakia
5.5%
AMBULATORY DISABILITY
100.0/ 100
METRIC RATING
35th/ 347
METRIC RANK
5.8%
AMBULATORY DISABILITY
97.4/ 100
METRIC RATING
105th/ 347
METRIC RANK
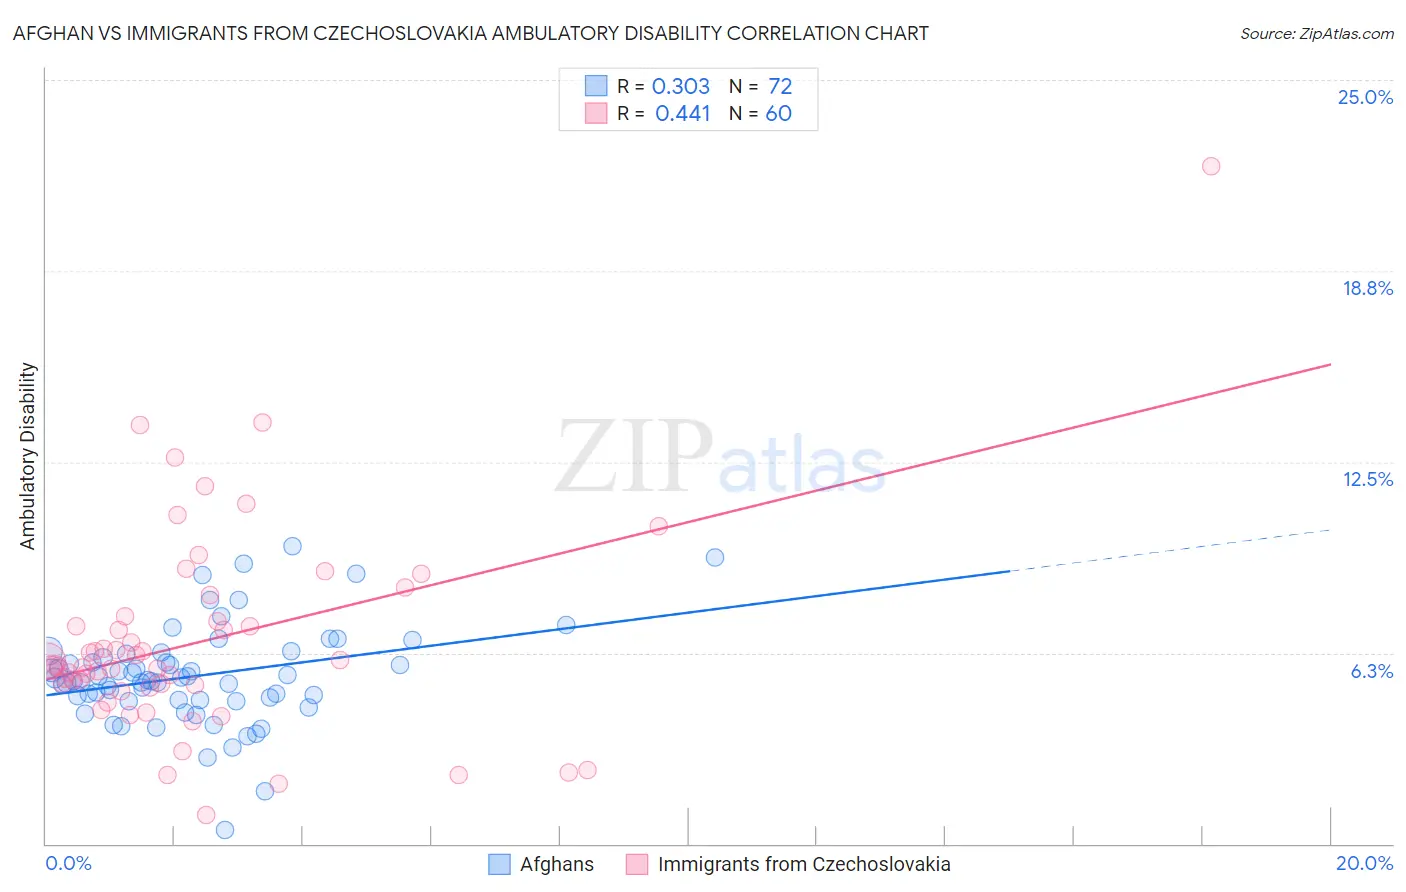
Afghan vs Immigrants from Czechoslovakia Ambulatory Disability Correlation Chart
The statistical analysis conducted on geographies consisting of 148,854,459 people shows a mild positive correlation between the proportion of Afghans and percentage of population with ambulatory disability in the United States with a correlation coefficient (R) of 0.303 and weighted average of 5.5%. Similarly, the statistical analysis conducted on geographies consisting of 195,441,857 people shows a moderate positive correlation between the proportion of Immigrants from Czechoslovakia and percentage of population with ambulatory disability in the United States with a correlation coefficient (R) of 0.441 and weighted average of 5.8%, a difference of 6.4%.
Ambulatory Disability Correlation Summary
| Measurement | Afghan | Immigrants from Czechoslovakia |
| Minimum | 0.43% | 0.95% |
| Maximum | 9.8% | 22.2% |
| Range | 9.3% | 21.2% |
| Mean | 5.5% | 6.6% |
| Median | 5.3% | 5.8% |
| Interquartile 25% (IQ1) | 4.7% | 5.2% |
| Interquartile 75% (IQ3) | 6.2% | 7.4% |
| Interquartile Range (IQR) | 1.5% | 2.2% |
| Standard Deviation (Sample) | 1.6% | 3.4% |
| Standard Deviation (Population) | 1.6% | 3.4% |
Similar Demographics by Ambulatory Disability
Demographics Similar to Afghans by Ambulatory Disability
In terms of ambulatory disability, the demographic groups most similar to Afghans are Immigrants from Asia (5.5%, a difference of 0.040%), Immigrants from Malaysia (5.5%, a difference of 0.070%), Turkish (5.5%, a difference of 0.080%), Cypriot (5.5%, a difference of 0.090%), and Immigrants from Eritrea (5.5%, a difference of 0.18%).
| Demographics | Rating | Rank | Ambulatory Disability |
| Cambodians | 100.0 /100 | #28 | Exceptional 5.4% |
| Immigrants | Iran | 100.0 /100 | #29 | Exceptional 5.4% |
| Immigrants | Turkey | 100.0 /100 | #30 | Exceptional 5.4% |
| Immigrants | Venezuela | 100.0 /100 | #31 | Exceptional 5.4% |
| Immigrants | Australia | 100.0 /100 | #32 | Exceptional 5.5% |
| Immigrants | Pakistan | 100.0 /100 | #33 | Exceptional 5.5% |
| Immigrants | Asia | 100.0 /100 | #34 | Exceptional 5.5% |
| Afghans | 100.0 /100 | #35 | Exceptional 5.5% |
| Immigrants | Malaysia | 100.0 /100 | #36 | Exceptional 5.5% |
| Turks | 100.0 /100 | #37 | Exceptional 5.5% |
| Cypriots | 100.0 /100 | #38 | Exceptional 5.5% |
| Immigrants | Eritrea | 100.0 /100 | #39 | Exceptional 5.5% |
| Venezuelans | 99.9 /100 | #40 | Exceptional 5.5% |
| Mongolians | 99.9 /100 | #41 | Exceptional 5.5% |
| Argentineans | 99.9 /100 | #42 | Exceptional 5.5% |
Demographics Similar to Immigrants from Czechoslovakia by Ambulatory Disability
In terms of ambulatory disability, the demographic groups most similar to Immigrants from Czechoslovakia are Immigrants from Morocco (5.8%, a difference of 0.070%), New Zealander (5.8%, a difference of 0.11%), Uruguayan (5.8%, a difference of 0.12%), Colombian (5.8%, a difference of 0.14%), and Immigrants from Netherlands (5.8%, a difference of 0.15%).
| Demographics | Rating | Rank | Ambulatory Disability |
| Immigrants | Lebanon | 98.3 /100 | #98 | Exceptional 5.8% |
| Immigrants | Northern Europe | 98.2 /100 | #99 | Exceptional 5.8% |
| Immigrants | Serbia | 97.9 /100 | #100 | Exceptional 5.8% |
| Immigrants | South America | 97.9 /100 | #101 | Exceptional 5.8% |
| Immigrants | Kenya | 97.8 /100 | #102 | Exceptional 5.8% |
| Immigrants | Romania | 97.7 /100 | #103 | Exceptional 5.8% |
| New Zealanders | 97.6 /100 | #104 | Exceptional 5.8% |
| Immigrants | Czechoslovakia | 97.4 /100 | #105 | Exceptional 5.8% |
| Immigrants | Morocco | 97.3 /100 | #106 | Exceptional 5.8% |
| Uruguayans | 97.2 /100 | #107 | Exceptional 5.8% |
| Colombians | 97.2 /100 | #108 | Exceptional 5.8% |
| Immigrants | Netherlands | 97.1 /100 | #109 | Exceptional 5.8% |
| Immigrants | Colombia | 96.7 /100 | #110 | Exceptional 5.8% |
| Danes | 96.6 /100 | #111 | Exceptional 5.8% |
| South Africans | 96.3 /100 | #112 | Exceptional 5.9% |