Inupiat vs Immigrants from Czechoslovakia Ambulatory Disability
COMPARE
Inupiat
Immigrants from Czechoslovakia
Ambulatory Disability
Ambulatory Disability Comparison
Inupiat
Immigrants from Czechoslovakia
5.6%
AMBULATORY DISABILITY
99.8/ 100
METRIC RATING
56th/ 347
METRIC RANK
5.8%
AMBULATORY DISABILITY
97.4/ 100
METRIC RATING
105th/ 347
METRIC RANK
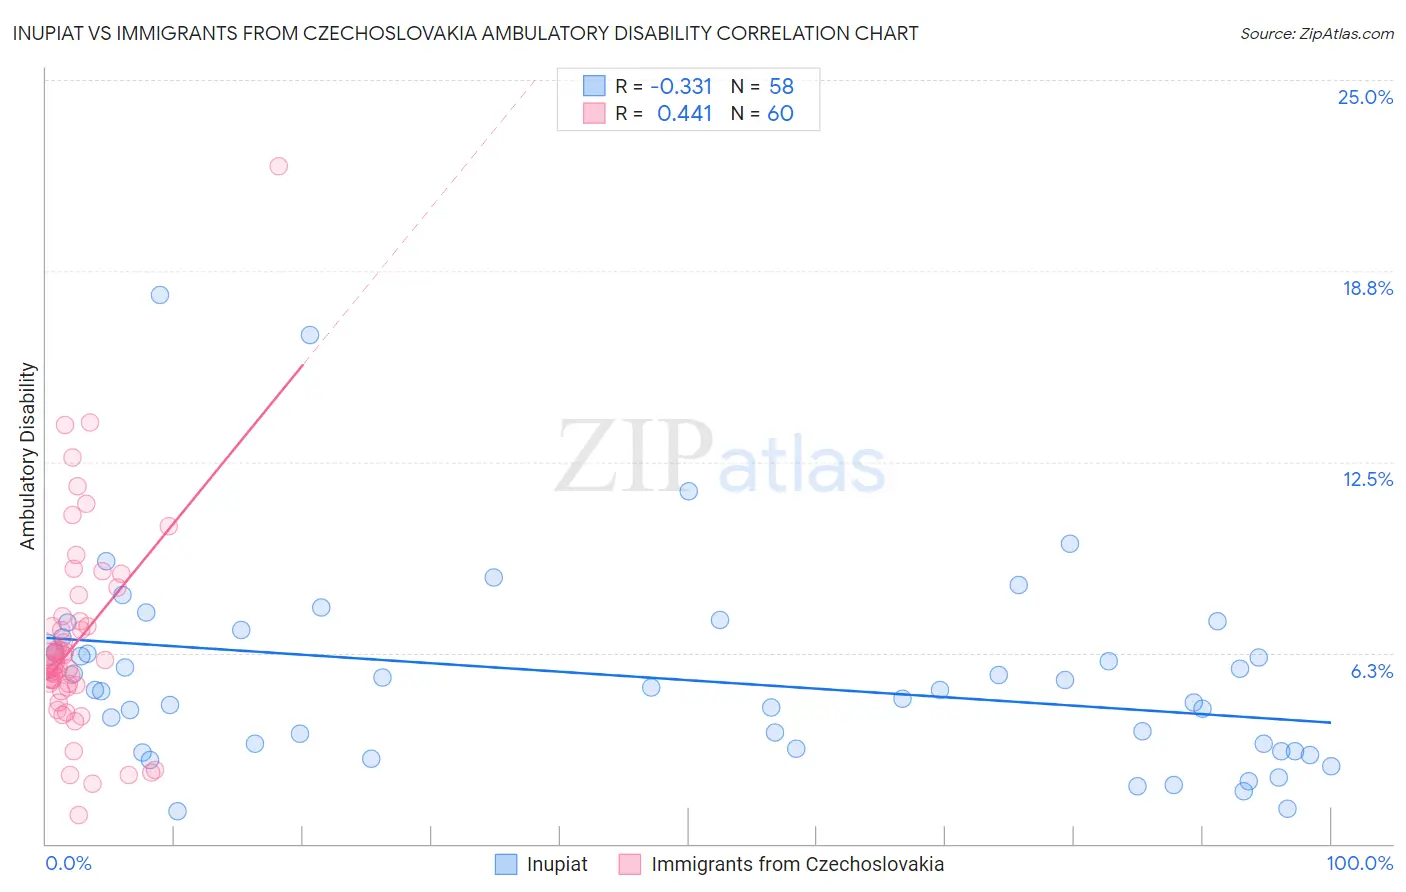
Inupiat vs Immigrants from Czechoslovakia Ambulatory Disability Correlation Chart
The statistical analysis conducted on geographies consisting of 96,327,130 people shows a mild negative correlation between the proportion of Inupiat and percentage of population with ambulatory disability in the United States with a correlation coefficient (R) of -0.331 and weighted average of 5.6%. Similarly, the statistical analysis conducted on geographies consisting of 195,441,857 people shows a moderate positive correlation between the proportion of Immigrants from Czechoslovakia and percentage of population with ambulatory disability in the United States with a correlation coefficient (R) of 0.441 and weighted average of 5.8%, a difference of 3.8%.
Ambulatory Disability Correlation Summary
| Measurement | Inupiat | Immigrants from Czechoslovakia |
| Minimum | 1.1% | 0.95% |
| Maximum | 18.0% | 22.2% |
| Range | 16.9% | 21.2% |
| Mean | 5.4% | 6.6% |
| Median | 5.0% | 5.8% |
| Interquartile 25% (IQ1) | 3.1% | 5.2% |
| Interquartile 75% (IQ3) | 6.8% | 7.4% |
| Interquartile Range (IQR) | 3.7% | 2.2% |
| Standard Deviation (Sample) | 3.2% | 3.4% |
| Standard Deviation (Population) | 3.2% | 3.4% |
Similar Demographics by Ambulatory Disability
Demographics Similar to Inupiat by Ambulatory Disability
In terms of ambulatory disability, the demographic groups most similar to Inupiat are Immigrants from Bulgaria (5.6%, a difference of 0.090%), Immigrants from Eastern Africa (5.6%, a difference of 0.16%), Immigrants from Egypt (5.6%, a difference of 0.20%), Jordanian (5.6%, a difference of 0.21%), and Immigrants from Brazil (5.6%, a difference of 0.24%).
| Demographics | Rating | Rank | Ambulatory Disability |
| Bulgarians | 99.9 /100 | #49 | Exceptional 5.6% |
| Luxembourgers | 99.9 /100 | #50 | Exceptional 5.6% |
| Taiwanese | 99.8 /100 | #51 | Exceptional 5.6% |
| Jordanians | 99.8 /100 | #52 | Exceptional 5.6% |
| Immigrants | Egypt | 99.8 /100 | #53 | Exceptional 5.6% |
| Immigrants | Eastern Africa | 99.8 /100 | #54 | Exceptional 5.6% |
| Immigrants | Bulgaria | 99.8 /100 | #55 | Exceptional 5.6% |
| Inupiat | 99.8 /100 | #56 | Exceptional 5.6% |
| Immigrants | Brazil | 99.8 /100 | #57 | Exceptional 5.6% |
| Immigrants | Zimbabwe | 99.8 /100 | #58 | Exceptional 5.6% |
| Immigrants | Afghanistan | 99.8 /100 | #59 | Exceptional 5.6% |
| Immigrants | Lithuania | 99.8 /100 | #60 | Exceptional 5.6% |
| Immigrants | Belgium | 99.7 /100 | #61 | Exceptional 5.6% |
| Immigrants | Spain | 99.7 /100 | #62 | Exceptional 5.6% |
| Immigrants | France | 99.7 /100 | #63 | Exceptional 5.6% |
Demographics Similar to Immigrants from Czechoslovakia by Ambulatory Disability
In terms of ambulatory disability, the demographic groups most similar to Immigrants from Czechoslovakia are Immigrants from Morocco (5.8%, a difference of 0.070%), New Zealander (5.8%, a difference of 0.11%), Uruguayan (5.8%, a difference of 0.12%), Colombian (5.8%, a difference of 0.14%), and Immigrants from Netherlands (5.8%, a difference of 0.15%).
| Demographics | Rating | Rank | Ambulatory Disability |
| Immigrants | Lebanon | 98.3 /100 | #98 | Exceptional 5.8% |
| Immigrants | Northern Europe | 98.2 /100 | #99 | Exceptional 5.8% |
| Immigrants | Serbia | 97.9 /100 | #100 | Exceptional 5.8% |
| Immigrants | South America | 97.9 /100 | #101 | Exceptional 5.8% |
| Immigrants | Kenya | 97.8 /100 | #102 | Exceptional 5.8% |
| Immigrants | Romania | 97.7 /100 | #103 | Exceptional 5.8% |
| New Zealanders | 97.6 /100 | #104 | Exceptional 5.8% |
| Immigrants | Czechoslovakia | 97.4 /100 | #105 | Exceptional 5.8% |
| Immigrants | Morocco | 97.3 /100 | #106 | Exceptional 5.8% |
| Uruguayans | 97.2 /100 | #107 | Exceptional 5.8% |
| Colombians | 97.2 /100 | #108 | Exceptional 5.8% |
| Immigrants | Netherlands | 97.1 /100 | #109 | Exceptional 5.8% |
| Immigrants | Colombia | 96.7 /100 | #110 | Exceptional 5.8% |
| Danes | 96.6 /100 | #111 | Exceptional 5.8% |
| South Africans | 96.3 /100 | #112 | Exceptional 5.9% |