Arapaho vs Immigrants from Czechoslovakia Ambulatory Disability
COMPARE
Arapaho
Immigrants from Czechoslovakia
Ambulatory Disability
Ambulatory Disability Comparison
Arapaho
Immigrants from Czechoslovakia
7.1%
AMBULATORY DISABILITY
0.0/ 100
METRIC RATING
310th/ 347
METRIC RANK
5.8%
AMBULATORY DISABILITY
97.4/ 100
METRIC RATING
105th/ 347
METRIC RANK
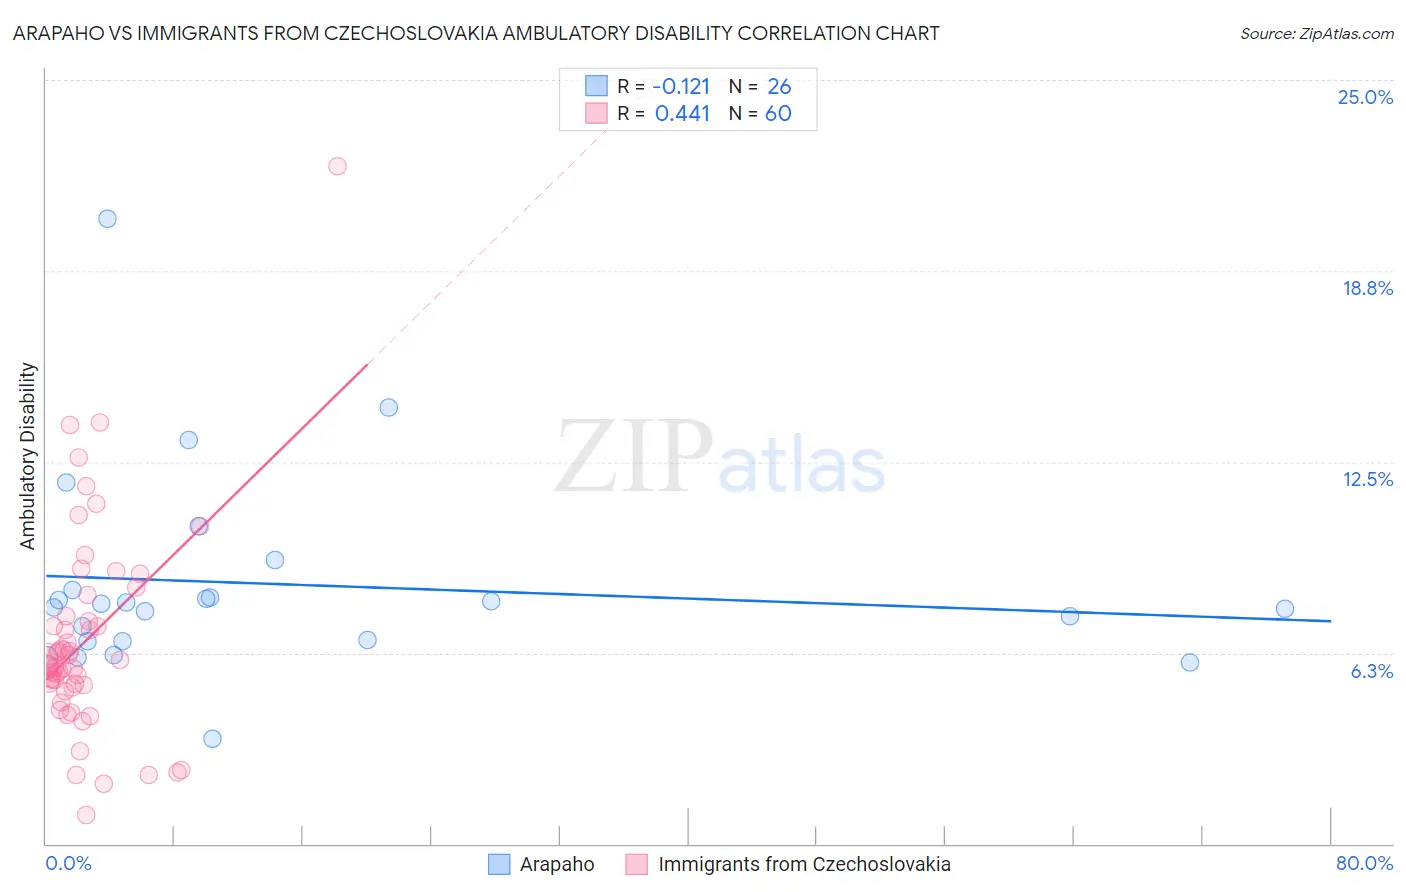
Arapaho vs Immigrants from Czechoslovakia Ambulatory Disability Correlation Chart
The statistical analysis conducted on geographies consisting of 29,778,859 people shows a poor negative correlation between the proportion of Arapaho and percentage of population with ambulatory disability in the United States with a correlation coefficient (R) of -0.121 and weighted average of 7.1%. Similarly, the statistical analysis conducted on geographies consisting of 195,441,857 people shows a moderate positive correlation between the proportion of Immigrants from Czechoslovakia and percentage of population with ambulatory disability in the United States with a correlation coefficient (R) of 0.441 and weighted average of 5.8%, a difference of 22.0%.
Ambulatory Disability Correlation Summary
| Measurement | Arapaho | Immigrants from Czechoslovakia |
| Minimum | 3.4% | 0.95% |
| Maximum | 20.4% | 22.2% |
| Range | 17.0% | 21.2% |
| Mean | 8.5% | 6.6% |
| Median | 7.8% | 5.8% |
| Interquartile 25% (IQ1) | 6.6% | 5.2% |
| Interquartile 75% (IQ3) | 8.3% | 7.4% |
| Interquartile Range (IQR) | 1.7% | 2.2% |
| Standard Deviation (Sample) | 3.3% | 3.4% |
| Standard Deviation (Population) | 3.3% | 3.4% |
Similar Demographics by Ambulatory Disability
Demographics Similar to Arapaho by Ambulatory Disability
In terms of ambulatory disability, the demographic groups most similar to Arapaho are Cree (7.1%, a difference of 0.010%), Delaware (7.1%, a difference of 0.23%), Immigrants from the Azores (7.1%, a difference of 0.28%), Immigrants from Yemen (7.1%, a difference of 0.36%), and Blackfeet (7.1%, a difference of 0.39%).
| Demographics | Rating | Rank | Ambulatory Disability |
| Africans | 0.0 /100 | #303 | Tragic 7.0% |
| Immigrants | Cabo Verde | 0.0 /100 | #304 | Tragic 7.0% |
| Immigrants | Micronesia | 0.0 /100 | #305 | Tragic 7.0% |
| Iroquois | 0.0 /100 | #306 | Tragic 7.1% |
| Spanish Americans | 0.0 /100 | #307 | Tragic 7.1% |
| Chippewa | 0.0 /100 | #308 | Tragic 7.1% |
| Immigrants | Azores | 0.0 /100 | #309 | Tragic 7.1% |
| Arapaho | 0.0 /100 | #310 | Tragic 7.1% |
| Cree | 0.0 /100 | #311 | Tragic 7.1% |
| Delaware | 0.0 /100 | #312 | Tragic 7.1% |
| Immigrants | Yemen | 0.0 /100 | #313 | Tragic 7.1% |
| Blackfeet | 0.0 /100 | #314 | Tragic 7.1% |
| Shoshone | 0.0 /100 | #315 | Tragic 7.1% |
| Immigrants | Dominican Republic | 0.0 /100 | #316 | Tragic 7.1% |
| Central American Indians | 0.0 /100 | #317 | Tragic 7.2% |
Demographics Similar to Immigrants from Czechoslovakia by Ambulatory Disability
In terms of ambulatory disability, the demographic groups most similar to Immigrants from Czechoslovakia are Immigrants from Morocco (5.8%, a difference of 0.070%), New Zealander (5.8%, a difference of 0.11%), Uruguayan (5.8%, a difference of 0.12%), Colombian (5.8%, a difference of 0.14%), and Immigrants from Netherlands (5.8%, a difference of 0.15%).
| Demographics | Rating | Rank | Ambulatory Disability |
| Immigrants | Lebanon | 98.3 /100 | #98 | Exceptional 5.8% |
| Immigrants | Northern Europe | 98.2 /100 | #99 | Exceptional 5.8% |
| Immigrants | Serbia | 97.9 /100 | #100 | Exceptional 5.8% |
| Immigrants | South America | 97.9 /100 | #101 | Exceptional 5.8% |
| Immigrants | Kenya | 97.8 /100 | #102 | Exceptional 5.8% |
| Immigrants | Romania | 97.7 /100 | #103 | Exceptional 5.8% |
| New Zealanders | 97.6 /100 | #104 | Exceptional 5.8% |
| Immigrants | Czechoslovakia | 97.4 /100 | #105 | Exceptional 5.8% |
| Immigrants | Morocco | 97.3 /100 | #106 | Exceptional 5.8% |
| Uruguayans | 97.2 /100 | #107 | Exceptional 5.8% |
| Colombians | 97.2 /100 | #108 | Exceptional 5.8% |
| Immigrants | Netherlands | 97.1 /100 | #109 | Exceptional 5.8% |
| Immigrants | Colombia | 96.7 /100 | #110 | Exceptional 5.8% |
| Danes | 96.6 /100 | #111 | Exceptional 5.8% |
| South Africans | 96.3 /100 | #112 | Exceptional 5.9% |