Albanian vs Immigrants from Czechoslovakia Ambulatory Disability
COMPARE
Albanian
Immigrants from Czechoslovakia
Ambulatory Disability
Ambulatory Disability Comparison
Albanians
Immigrants from Czechoslovakia
6.2%
AMBULATORY DISABILITY
19.7/ 100
METRIC RATING
202nd/ 347
METRIC RANK
5.8%
AMBULATORY DISABILITY
97.4/ 100
METRIC RATING
105th/ 347
METRIC RANK
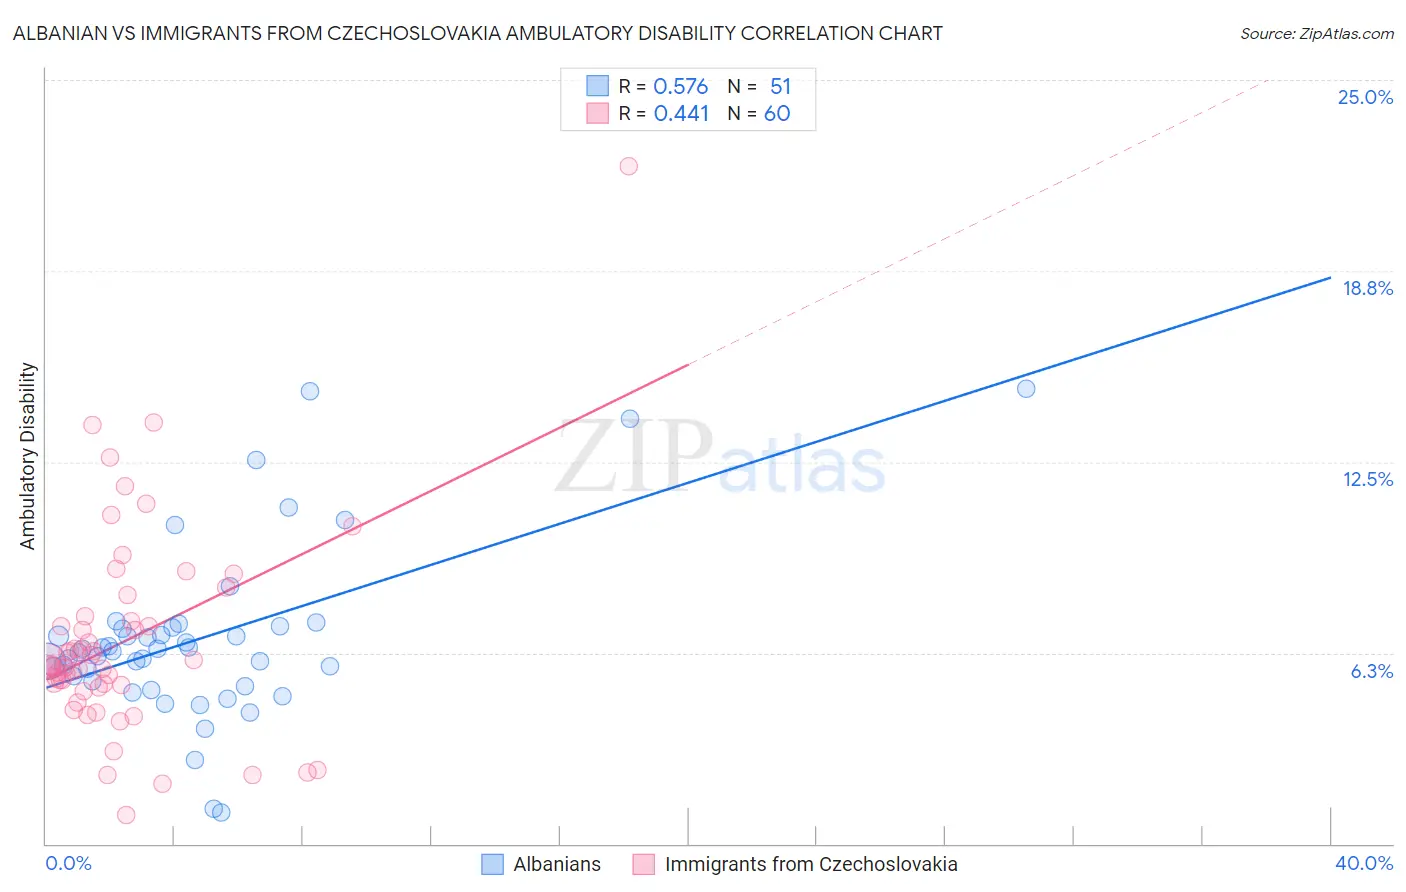
Albanian vs Immigrants from Czechoslovakia Ambulatory Disability Correlation Chart
The statistical analysis conducted on geographies consisting of 193,248,883 people shows a substantial positive correlation between the proportion of Albanians and percentage of population with ambulatory disability in the United States with a correlation coefficient (R) of 0.576 and weighted average of 6.2%. Similarly, the statistical analysis conducted on geographies consisting of 195,441,857 people shows a moderate positive correlation between the proportion of Immigrants from Czechoslovakia and percentage of population with ambulatory disability in the United States with a correlation coefficient (R) of 0.441 and weighted average of 5.8%, a difference of 7.0%.
Ambulatory Disability Correlation Summary
| Measurement | Albanian | Immigrants from Czechoslovakia |
| Minimum | 1.0% | 0.95% |
| Maximum | 14.9% | 22.2% |
| Range | 13.9% | 21.2% |
| Mean | 6.7% | 6.6% |
| Median | 6.3% | 5.8% |
| Interquartile 25% (IQ1) | 5.3% | 5.2% |
| Interquartile 75% (IQ3) | 7.1% | 7.4% |
| Interquartile Range (IQR) | 1.7% | 2.2% |
| Standard Deviation (Sample) | 2.8% | 3.4% |
| Standard Deviation (Population) | 2.8% | 3.4% |
Similar Demographics by Ambulatory Disability
Demographics Similar to Albanians by Ambulatory Disability
In terms of ambulatory disability, the demographic groups most similar to Albanians are Immigrants from Central America (6.2%, a difference of 0.030%), Immigrants from Ukraine (6.2%, a difference of 0.11%), Immigrants from Congo (6.2%, a difference of 0.13%), Immigrants from Cambodia (6.2%, a difference of 0.14%), and Slovene (6.2%, a difference of 0.15%).
| Demographics | Rating | Rank | Ambulatory Disability |
| Belgians | 28.6 /100 | #195 | Fair 6.2% |
| Malaysians | 28.2 /100 | #196 | Fair 6.2% |
| Poles | 26.3 /100 | #197 | Fair 6.2% |
| Immigrants | Bangladesh | 24.6 /100 | #198 | Fair 6.2% |
| Italians | 22.6 /100 | #199 | Fair 6.2% |
| Immigrants | Cambodia | 21.5 /100 | #200 | Fair 6.2% |
| Immigrants | Central America | 20.1 /100 | #201 | Fair 6.2% |
| Albanians | 19.7 /100 | #202 | Poor 6.2% |
| Immigrants | Ukraine | 18.4 /100 | #203 | Poor 6.2% |
| Immigrants | Congo | 18.2 /100 | #204 | Poor 6.2% |
| Slovenes | 18.0 /100 | #205 | Poor 6.2% |
| Finns | 17.2 /100 | #206 | Poor 6.2% |
| Alsatians | 15.1 /100 | #207 | Poor 6.3% |
| Bangladeshis | 14.2 /100 | #208 | Poor 6.3% |
| Immigrants | Iraq | 14.0 /100 | #209 | Poor 6.3% |
Demographics Similar to Immigrants from Czechoslovakia by Ambulatory Disability
In terms of ambulatory disability, the demographic groups most similar to Immigrants from Czechoslovakia are Immigrants from Morocco (5.8%, a difference of 0.070%), New Zealander (5.8%, a difference of 0.11%), Uruguayan (5.8%, a difference of 0.12%), Colombian (5.8%, a difference of 0.14%), and Immigrants from Netherlands (5.8%, a difference of 0.15%).
| Demographics | Rating | Rank | Ambulatory Disability |
| Immigrants | Lebanon | 98.3 /100 | #98 | Exceptional 5.8% |
| Immigrants | Northern Europe | 98.2 /100 | #99 | Exceptional 5.8% |
| Immigrants | Serbia | 97.9 /100 | #100 | Exceptional 5.8% |
| Immigrants | South America | 97.9 /100 | #101 | Exceptional 5.8% |
| Immigrants | Kenya | 97.8 /100 | #102 | Exceptional 5.8% |
| Immigrants | Romania | 97.7 /100 | #103 | Exceptional 5.8% |
| New Zealanders | 97.6 /100 | #104 | Exceptional 5.8% |
| Immigrants | Czechoslovakia | 97.4 /100 | #105 | Exceptional 5.8% |
| Immigrants | Morocco | 97.3 /100 | #106 | Exceptional 5.8% |
| Uruguayans | 97.2 /100 | #107 | Exceptional 5.8% |
| Colombians | 97.2 /100 | #108 | Exceptional 5.8% |
| Immigrants | Netherlands | 97.1 /100 | #109 | Exceptional 5.8% |
| Immigrants | Colombia | 96.7 /100 | #110 | Exceptional 5.8% |
| Danes | 96.6 /100 | #111 | Exceptional 5.8% |
| South Africans | 96.3 /100 | #112 | Exceptional 5.9% |