Jordanian vs Chickasaw Disability Age 5 to 17
COMPARE
Jordanian
Chickasaw
Disability Age 5 to 17
Disability Age 5 to 17 Comparison
Jordanians
Chickasaw
5.2%
DISABILITY AGE 5 TO 17
99.7/ 100
METRIC RATING
71st/ 347
METRIC RANK
6.8%
DISABILITY AGE 5 TO 17
0.0/ 100
METRIC RATING
336th/ 347
METRIC RANK
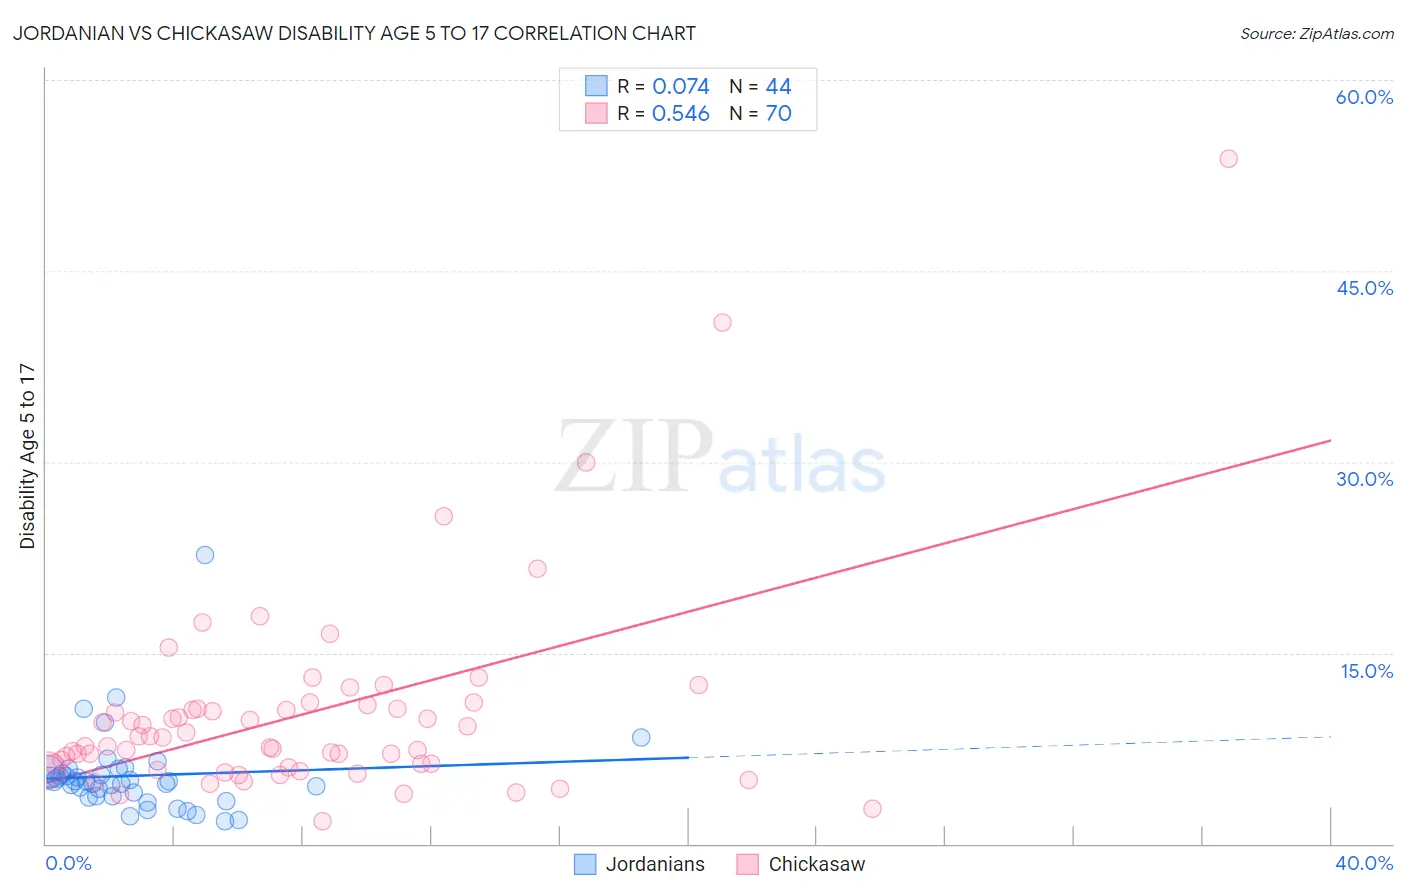
Jordanian vs Chickasaw Disability Age 5 to 17 Correlation Chart
The statistical analysis conducted on geographies consisting of 165,912,846 people shows a slight positive correlation between the proportion of Jordanians and percentage of population with a disability between the ages 5 and 17 in the United States with a correlation coefficient (R) of 0.074 and weighted average of 5.2%. Similarly, the statistical analysis conducted on geographies consisting of 147,149,878 people shows a substantial positive correlation between the proportion of Chickasaw and percentage of population with a disability between the ages 5 and 17 in the United States with a correlation coefficient (R) of 0.546 and weighted average of 6.8%, a difference of 31.6%.
Disability Age 5 to 17 Correlation Summary
| Measurement | Jordanian | Chickasaw |
| Minimum | 1.8% | 1.8% |
| Maximum | 22.7% | 53.8% |
| Range | 20.9% | 52.1% |
| Mean | 5.3% | 10.2% |
| Median | 4.9% | 8.0% |
| Interquartile 25% (IQ1) | 3.7% | 6.0% |
| Interquartile 75% (IQ3) | 5.6% | 10.6% |
| Interquartile Range (IQR) | 1.9% | 4.7% |
| Standard Deviation (Sample) | 3.4% | 8.1% |
| Standard Deviation (Population) | 3.3% | 8.1% |
Similar Demographics by Disability Age 5 to 17
Demographics Similar to Jordanians by Disability Age 5 to 17
In terms of disability age 5 to 17, the demographic groups most similar to Jordanians are Immigrants from Vietnam (5.2%, a difference of 0.020%), Immigrants from Belgium (5.2%, a difference of 0.050%), Immigrants from Czechoslovakia (5.2%, a difference of 0.050%), Guyanese (5.2%, a difference of 0.080%), and Immigrants from Romania (5.2%, a difference of 0.12%).
| Demographics | Rating | Rank | Disability Age 5 to 17 |
| Immigrants | South Eastern Asia | 99.8 /100 | #64 | Exceptional 5.2% |
| Immigrants | Greece | 99.8 /100 | #65 | Exceptional 5.2% |
| Palestinians | 99.8 /100 | #66 | Exceptional 5.2% |
| Macedonians | 99.8 /100 | #67 | Exceptional 5.2% |
| Immigrants | Syria | 99.7 /100 | #68 | Exceptional 5.2% |
| Guyanese | 99.7 /100 | #69 | Exceptional 5.2% |
| Immigrants | Belgium | 99.7 /100 | #70 | Exceptional 5.2% |
| Jordanians | 99.7 /100 | #71 | Exceptional 5.2% |
| Immigrants | Vietnam | 99.7 /100 | #72 | Exceptional 5.2% |
| Immigrants | Czechoslovakia | 99.7 /100 | #73 | Exceptional 5.2% |
| Immigrants | Romania | 99.7 /100 | #74 | Exceptional 5.2% |
| Immigrants | Moldova | 99.6 /100 | #75 | Exceptional 5.2% |
| Immigrants | Guyana | 99.6 /100 | #76 | Exceptional 5.2% |
| Immigrants | Kazakhstan | 99.6 /100 | #77 | Exceptional 5.2% |
| Immigrants | Cuba | 99.6 /100 | #78 | Exceptional 5.2% |
Demographics Similar to Chickasaw by Disability Age 5 to 17
In terms of disability age 5 to 17, the demographic groups most similar to Chickasaw are Creek (6.9%, a difference of 0.43%), Ottawa (6.8%, a difference of 0.50%), Iroquois (6.9%, a difference of 0.68%), Choctaw (6.9%, a difference of 1.0%), and Seminole (6.8%, a difference of 1.2%).
| Demographics | Rating | Rank | Disability Age 5 to 17 |
| Blackfeet | 0.0 /100 | #329 | Tragic 6.6% |
| Dutch West Indians | 0.0 /100 | #330 | Tragic 6.7% |
| French Canadians | 0.0 /100 | #331 | Tragic 6.7% |
| Immigrants | Azores | 0.0 /100 | #332 | Tragic 6.7% |
| Blacks/African Americans | 0.0 /100 | #333 | Tragic 6.8% |
| Seminole | 0.0 /100 | #334 | Tragic 6.8% |
| Ottawa | 0.0 /100 | #335 | Tragic 6.8% |
| Chickasaw | 0.0 /100 | #336 | Tragic 6.8% |
| Creek | 0.0 /100 | #337 | Tragic 6.9% |
| Iroquois | 0.0 /100 | #338 | Tragic 6.9% |
| Choctaw | 0.0 /100 | #339 | Tragic 6.9% |
| Cherokee | 0.0 /100 | #340 | Tragic 6.9% |
| Cape Verdeans | 0.0 /100 | #341 | Tragic 7.0% |
| Chippewa | 0.0 /100 | #342 | Tragic 7.1% |
| Immigrants | Cabo Verde | 0.0 /100 | #343 | Tragic 7.1% |