Immigrants from Hungary vs Chickasaw Disability Age 5 to 17
COMPARE
Immigrants from Hungary
Chickasaw
Disability Age 5 to 17
Disability Age 5 to 17 Comparison
Immigrants from Hungary
Chickasaw
5.5%
DISABILITY AGE 5 TO 17
87.9/ 100
METRIC RATING
143rd/ 347
METRIC RANK
6.8%
DISABILITY AGE 5 TO 17
0.0/ 100
METRIC RATING
336th/ 347
METRIC RANK
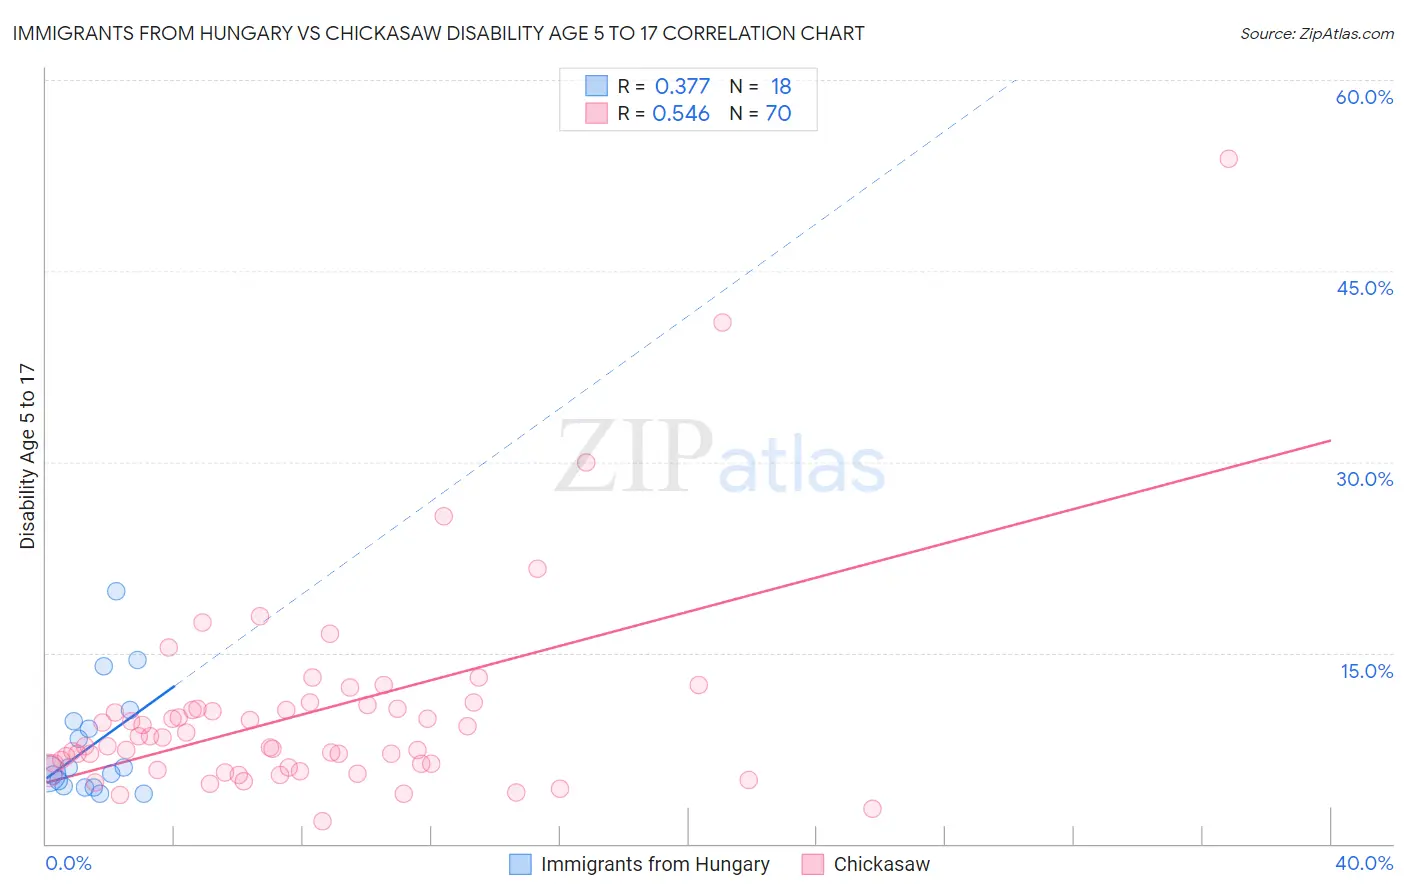
Immigrants from Hungary vs Chickasaw Disability Age 5 to 17 Correlation Chart
The statistical analysis conducted on geographies consisting of 194,505,610 people shows a mild positive correlation between the proportion of Immigrants from Hungary and percentage of population with a disability between the ages 5 and 17 in the United States with a correlation coefficient (R) of 0.377 and weighted average of 5.5%. Similarly, the statistical analysis conducted on geographies consisting of 147,149,878 people shows a substantial positive correlation between the proportion of Chickasaw and percentage of population with a disability between the ages 5 and 17 in the United States with a correlation coefficient (R) of 0.546 and weighted average of 6.8%, a difference of 25.2%.
Disability Age 5 to 17 Correlation Summary
| Measurement | Immigrants from Hungary | Chickasaw |
| Minimum | 3.9% | 1.8% |
| Maximum | 19.9% | 53.8% |
| Range | 16.0% | 52.1% |
| Mean | 7.8% | 10.2% |
| Median | 5.7% | 8.0% |
| Interquartile 25% (IQ1) | 4.5% | 6.0% |
| Interquartile 75% (IQ3) | 9.6% | 10.6% |
| Interquartile Range (IQR) | 5.1% | 4.7% |
| Standard Deviation (Sample) | 4.4% | 8.1% |
| Standard Deviation (Population) | 4.3% | 8.1% |
Similar Demographics by Disability Age 5 to 17
Demographics Similar to Immigrants from Hungary by Disability Age 5 to 17
In terms of disability age 5 to 17, the demographic groups most similar to Immigrants from Hungary are Colombian (5.5%, a difference of 0.020%), Pakistani (5.5%, a difference of 0.070%), Immigrants from Guatemala (5.5%, a difference of 0.14%), South American Indian (5.5%, a difference of 0.17%), and Immigrants from Netherlands (5.4%, a difference of 0.34%).
| Demographics | Rating | Rank | Disability Age 5 to 17 |
| Immigrants | Denmark | 91.4 /100 | #136 | Exceptional 5.4% |
| Navajo | 90.9 /100 | #137 | Exceptional 5.4% |
| Immigrants | Oceania | 90.8 /100 | #138 | Exceptional 5.4% |
| Belizeans | 90.8 /100 | #139 | Exceptional 5.4% |
| Immigrants | Netherlands | 90.5 /100 | #140 | Exceptional 5.4% |
| South American Indians | 89.3 /100 | #141 | Excellent 5.5% |
| Colombians | 88.0 /100 | #142 | Excellent 5.5% |
| Immigrants | Hungary | 87.9 /100 | #143 | Excellent 5.5% |
| Pakistanis | 87.3 /100 | #144 | Excellent 5.5% |
| Immigrants | Guatemala | 86.6 /100 | #145 | Excellent 5.5% |
| Albanians | 83.7 /100 | #146 | Excellent 5.5% |
| Immigrants | Albania | 83.1 /100 | #147 | Excellent 5.5% |
| Samoans | 81.9 /100 | #148 | Excellent 5.5% |
| Central Americans | 81.6 /100 | #149 | Excellent 5.5% |
| Guatemalans | 81.5 /100 | #150 | Excellent 5.5% |
Demographics Similar to Chickasaw by Disability Age 5 to 17
In terms of disability age 5 to 17, the demographic groups most similar to Chickasaw are Creek (6.9%, a difference of 0.43%), Ottawa (6.8%, a difference of 0.50%), Iroquois (6.9%, a difference of 0.68%), Choctaw (6.9%, a difference of 1.0%), and Seminole (6.8%, a difference of 1.2%).
| Demographics | Rating | Rank | Disability Age 5 to 17 |
| Blackfeet | 0.0 /100 | #329 | Tragic 6.6% |
| Dutch West Indians | 0.0 /100 | #330 | Tragic 6.7% |
| French Canadians | 0.0 /100 | #331 | Tragic 6.7% |
| Immigrants | Azores | 0.0 /100 | #332 | Tragic 6.7% |
| Blacks/African Americans | 0.0 /100 | #333 | Tragic 6.8% |
| Seminole | 0.0 /100 | #334 | Tragic 6.8% |
| Ottawa | 0.0 /100 | #335 | Tragic 6.8% |
| Chickasaw | 0.0 /100 | #336 | Tragic 6.8% |
| Creek | 0.0 /100 | #337 | Tragic 6.9% |
| Iroquois | 0.0 /100 | #338 | Tragic 6.9% |
| Choctaw | 0.0 /100 | #339 | Tragic 6.9% |
| Cherokee | 0.0 /100 | #340 | Tragic 6.9% |
| Cape Verdeans | 0.0 /100 | #341 | Tragic 7.0% |
| Chippewa | 0.0 /100 | #342 | Tragic 7.1% |
| Immigrants | Cabo Verde | 0.0 /100 | #343 | Tragic 7.1% |