Jordanian vs White/Caucasian Disability Age 5 to 17
COMPARE
Jordanian
White/Caucasian
Disability Age 5 to 17
Disability Age 5 to 17 Comparison
Jordanians
Whites/Caucasians
5.2%
DISABILITY AGE 5 TO 17
99.7/ 100
METRIC RATING
71st/ 347
METRIC RANK
6.2%
DISABILITY AGE 5 TO 17
0.0/ 100
METRIC RATING
291st/ 347
METRIC RANK
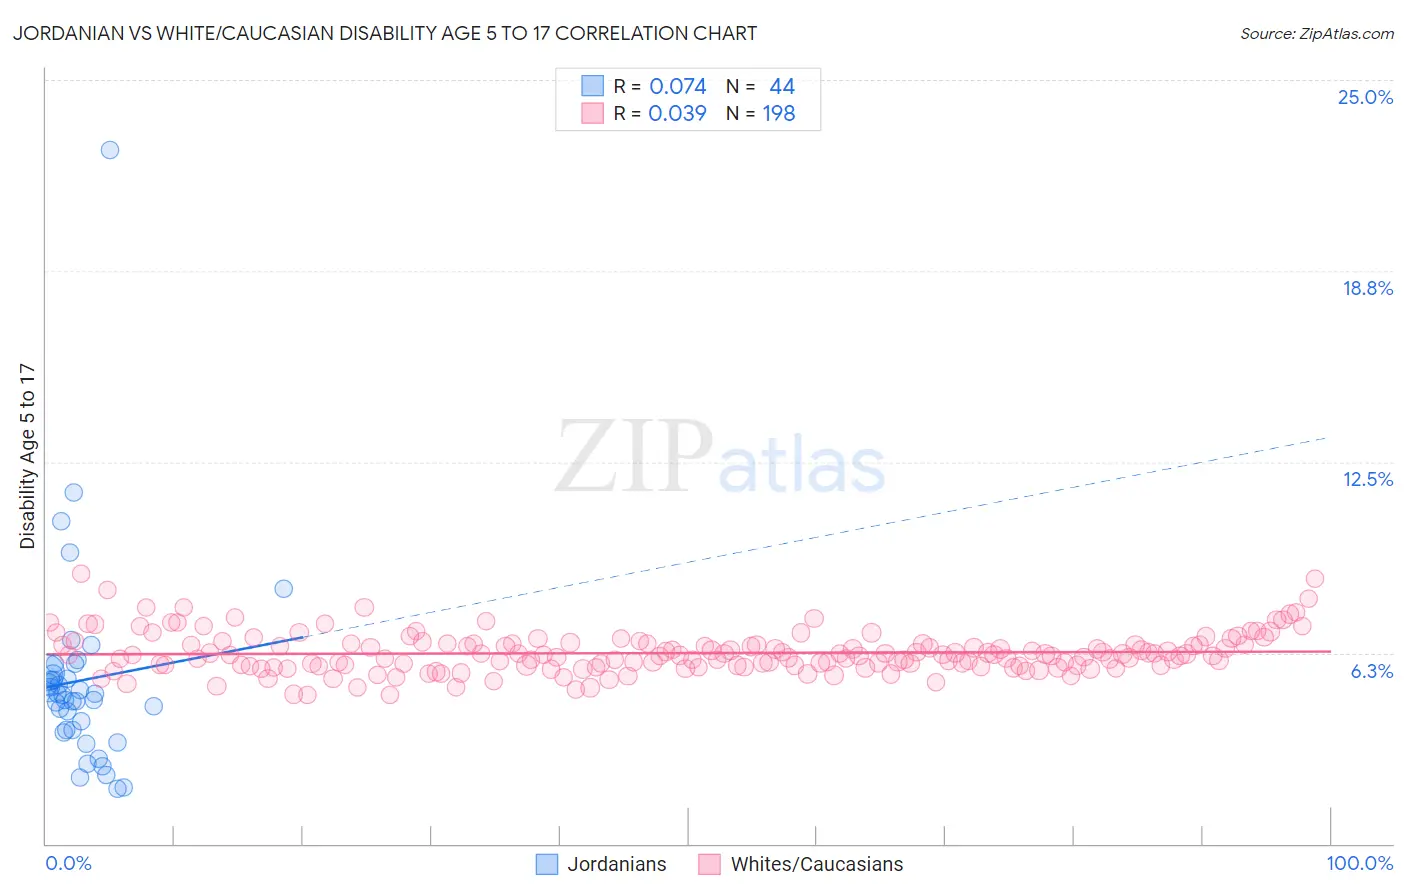
Jordanian vs White/Caucasian Disability Age 5 to 17 Correlation Chart
The statistical analysis conducted on geographies consisting of 165,912,846 people shows a slight positive correlation between the proportion of Jordanians and percentage of population with a disability between the ages 5 and 17 in the United States with a correlation coefficient (R) of 0.074 and weighted average of 5.2%. Similarly, the statistical analysis conducted on geographies consisting of 566,464,467 people shows no correlation between the proportion of Whites/Caucasians and percentage of population with a disability between the ages 5 and 17 in the United States with a correlation coefficient (R) of 0.039 and weighted average of 6.2%, a difference of 19.3%.
Disability Age 5 to 17 Correlation Summary
| Measurement | Jordanian | White/Caucasian |
| Minimum | 1.8% | 4.9% |
| Maximum | 22.7% | 8.8% |
| Range | 20.9% | 4.0% |
| Mean | 5.3% | 6.2% |
| Median | 4.9% | 6.2% |
| Interquartile 25% (IQ1) | 3.7% | 5.8% |
| Interquartile 75% (IQ3) | 5.6% | 6.6% |
| Interquartile Range (IQR) | 1.9% | 0.72% |
| Standard Deviation (Sample) | 3.4% | 0.66% |
| Standard Deviation (Population) | 3.3% | 0.66% |
Similar Demographics by Disability Age 5 to 17
Demographics Similar to Jordanians by Disability Age 5 to 17
In terms of disability age 5 to 17, the demographic groups most similar to Jordanians are Immigrants from Vietnam (5.2%, a difference of 0.020%), Immigrants from Belgium (5.2%, a difference of 0.050%), Immigrants from Czechoslovakia (5.2%, a difference of 0.050%), Guyanese (5.2%, a difference of 0.080%), and Immigrants from Romania (5.2%, a difference of 0.12%).
| Demographics | Rating | Rank | Disability Age 5 to 17 |
| Immigrants | South Eastern Asia | 99.8 /100 | #64 | Exceptional 5.2% |
| Immigrants | Greece | 99.8 /100 | #65 | Exceptional 5.2% |
| Palestinians | 99.8 /100 | #66 | Exceptional 5.2% |
| Macedonians | 99.8 /100 | #67 | Exceptional 5.2% |
| Immigrants | Syria | 99.7 /100 | #68 | Exceptional 5.2% |
| Guyanese | 99.7 /100 | #69 | Exceptional 5.2% |
| Immigrants | Belgium | 99.7 /100 | #70 | Exceptional 5.2% |
| Jordanians | 99.7 /100 | #71 | Exceptional 5.2% |
| Immigrants | Vietnam | 99.7 /100 | #72 | Exceptional 5.2% |
| Immigrants | Czechoslovakia | 99.7 /100 | #73 | Exceptional 5.2% |
| Immigrants | Romania | 99.7 /100 | #74 | Exceptional 5.2% |
| Immigrants | Moldova | 99.6 /100 | #75 | Exceptional 5.2% |
| Immigrants | Guyana | 99.6 /100 | #76 | Exceptional 5.2% |
| Immigrants | Kazakhstan | 99.6 /100 | #77 | Exceptional 5.2% |
| Immigrants | Cuba | 99.6 /100 | #78 | Exceptional 5.2% |
Demographics Similar to Whites/Caucasians by Disability Age 5 to 17
In terms of disability age 5 to 17, the demographic groups most similar to Whites/Caucasians are Jamaican (6.2%, a difference of 0.15%), Yaqui (6.2%, a difference of 0.15%), Immigrants from Congo (6.2%, a difference of 0.15%), Immigrants from Senegal (6.2%, a difference of 0.24%), and Central American Indian (6.2%, a difference of 0.26%).
| Demographics | Rating | Rank | Disability Age 5 to 17 |
| Sub-Saharan Africans | 0.0 /100 | #284 | Tragic 6.2% |
| English | 0.0 /100 | #285 | Tragic 6.2% |
| Colville | 0.0 /100 | #286 | Tragic 6.2% |
| Pima | 0.0 /100 | #287 | Tragic 6.2% |
| Jamaicans | 0.0 /100 | #288 | Tragic 6.2% |
| Yaqui | 0.0 /100 | #289 | Tragic 6.2% |
| Immigrants | Congo | 0.0 /100 | #290 | Tragic 6.2% |
| Whites/Caucasians | 0.0 /100 | #291 | Tragic 6.2% |
| Immigrants | Senegal | 0.0 /100 | #292 | Tragic 6.2% |
| Central American Indians | 0.0 /100 | #293 | Tragic 6.2% |
| Irish | 0.0 /100 | #294 | Tragic 6.2% |
| Cree | 0.0 /100 | #295 | Tragic 6.2% |
| Spanish Americans | 0.0 /100 | #296 | Tragic 6.2% |
| Immigrants | Bahamas | 0.0 /100 | #297 | Tragic 6.2% |
| Lumbee | 0.0 /100 | #298 | Tragic 6.2% |