Immigrants from Philippines vs Chickasaw Disability Age 5 to 17
COMPARE
Immigrants from Philippines
Chickasaw
Disability Age 5 to 17
Disability Age 5 to 17 Comparison
Immigrants from Philippines
Chickasaw
5.0%
DISABILITY AGE 5 TO 17
100.0/ 100
METRIC RATING
38th/ 347
METRIC RANK
6.8%
DISABILITY AGE 5 TO 17
0.0/ 100
METRIC RATING
336th/ 347
METRIC RANK
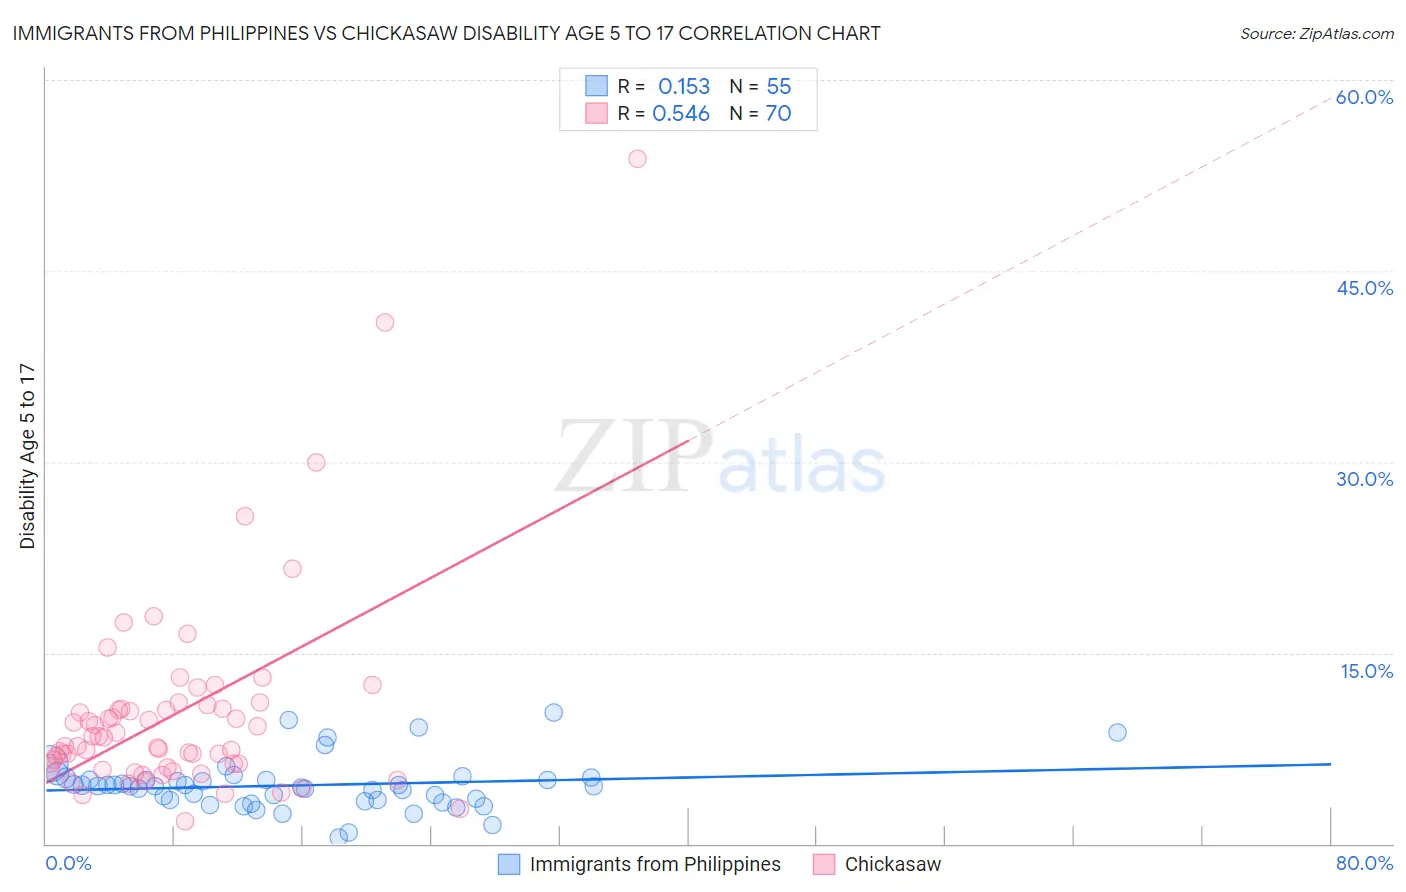
Immigrants from Philippines vs Chickasaw Disability Age 5 to 17 Correlation Chart
The statistical analysis conducted on geographies consisting of 466,357,424 people shows a poor positive correlation between the proportion of Immigrants from Philippines and percentage of population with a disability between the ages 5 and 17 in the United States with a correlation coefficient (R) of 0.153 and weighted average of 5.0%. Similarly, the statistical analysis conducted on geographies consisting of 147,149,878 people shows a substantial positive correlation between the proportion of Chickasaw and percentage of population with a disability between the ages 5 and 17 in the United States with a correlation coefficient (R) of 0.546 and weighted average of 6.8%, a difference of 36.5%.
Disability Age 5 to 17 Correlation Summary
| Measurement | Immigrants from Philippines | Chickasaw |
| Minimum | 0.51% | 1.8% |
| Maximum | 10.3% | 53.8% |
| Range | 9.8% | 52.1% |
| Mean | 4.6% | 10.2% |
| Median | 4.5% | 8.0% |
| Interquartile 25% (IQ1) | 3.4% | 6.0% |
| Interquartile 75% (IQ3) | 5.0% | 10.6% |
| Interquartile Range (IQR) | 1.6% | 4.7% |
| Standard Deviation (Sample) | 2.0% | 8.1% |
| Standard Deviation (Population) | 1.9% | 8.1% |
Similar Demographics by Disability Age 5 to 17
Demographics Similar to Immigrants from Philippines by Disability Age 5 to 17
In terms of disability age 5 to 17, the demographic groups most similar to Immigrants from Philippines are Immigrants from Argentina (5.0%, a difference of 0.010%), Immigrants from Belarus (5.0%, a difference of 0.040%), Immigrants from Egypt (5.0%, a difference of 0.070%), Okinawan (5.0%, a difference of 0.090%), and Bolivian (5.0%, a difference of 0.11%).
| Demographics | Rating | Rank | Disability Age 5 to 17 |
| Immigrants | Pakistan | 100.0 /100 | #31 | Exceptional 5.0% |
| Soviet Union | 100.0 /100 | #32 | Exceptional 5.0% |
| Immigrants | Indonesia | 100.0 /100 | #33 | Exceptional 5.0% |
| Israelis | 100.0 /100 | #34 | Exceptional 5.0% |
| Bolivians | 100.0 /100 | #35 | Exceptional 5.0% |
| Immigrants | Egypt | 100.0 /100 | #36 | Exceptional 5.0% |
| Immigrants | Belarus | 100.0 /100 | #37 | Exceptional 5.0% |
| Immigrants | Philippines | 100.0 /100 | #38 | Exceptional 5.0% |
| Immigrants | Argentina | 100.0 /100 | #39 | Exceptional 5.0% |
| Okinawans | 100.0 /100 | #40 | Exceptional 5.0% |
| Immigrants | Australia | 100.0 /100 | #41 | Exceptional 5.0% |
| Immigrants | Sri Lanka | 100.0 /100 | #42 | Exceptional 5.0% |
| Immigrants | Russia | 100.0 /100 | #43 | Exceptional 5.0% |
| Egyptians | 100.0 /100 | #44 | Exceptional 5.0% |
| Tongans | 100.0 /100 | #45 | Exceptional 5.0% |
Demographics Similar to Chickasaw by Disability Age 5 to 17
In terms of disability age 5 to 17, the demographic groups most similar to Chickasaw are Creek (6.9%, a difference of 0.43%), Ottawa (6.8%, a difference of 0.50%), Iroquois (6.9%, a difference of 0.68%), Choctaw (6.9%, a difference of 1.0%), and Seminole (6.8%, a difference of 1.2%).
| Demographics | Rating | Rank | Disability Age 5 to 17 |
| Blackfeet | 0.0 /100 | #329 | Tragic 6.6% |
| Dutch West Indians | 0.0 /100 | #330 | Tragic 6.7% |
| French Canadians | 0.0 /100 | #331 | Tragic 6.7% |
| Immigrants | Azores | 0.0 /100 | #332 | Tragic 6.7% |
| Blacks/African Americans | 0.0 /100 | #333 | Tragic 6.8% |
| Seminole | 0.0 /100 | #334 | Tragic 6.8% |
| Ottawa | 0.0 /100 | #335 | Tragic 6.8% |
| Chickasaw | 0.0 /100 | #336 | Tragic 6.8% |
| Creek | 0.0 /100 | #337 | Tragic 6.9% |
| Iroquois | 0.0 /100 | #338 | Tragic 6.9% |
| Choctaw | 0.0 /100 | #339 | Tragic 6.9% |
| Cherokee | 0.0 /100 | #340 | Tragic 6.9% |
| Cape Verdeans | 0.0 /100 | #341 | Tragic 7.0% |
| Chippewa | 0.0 /100 | #342 | Tragic 7.1% |
| Immigrants | Cabo Verde | 0.0 /100 | #343 | Tragic 7.1% |