Iroquois vs White/Caucasian Disability Age 5 to 17
COMPARE
Iroquois
White/Caucasian
Disability Age 5 to 17
Disability Age 5 to 17 Comparison
Iroquois
Whites/Caucasians
6.9%
DISABILITY AGE 5 TO 17
0.0/ 100
METRIC RATING
338th/ 347
METRIC RANK
6.2%
DISABILITY AGE 5 TO 17
0.0/ 100
METRIC RATING
291st/ 347
METRIC RANK
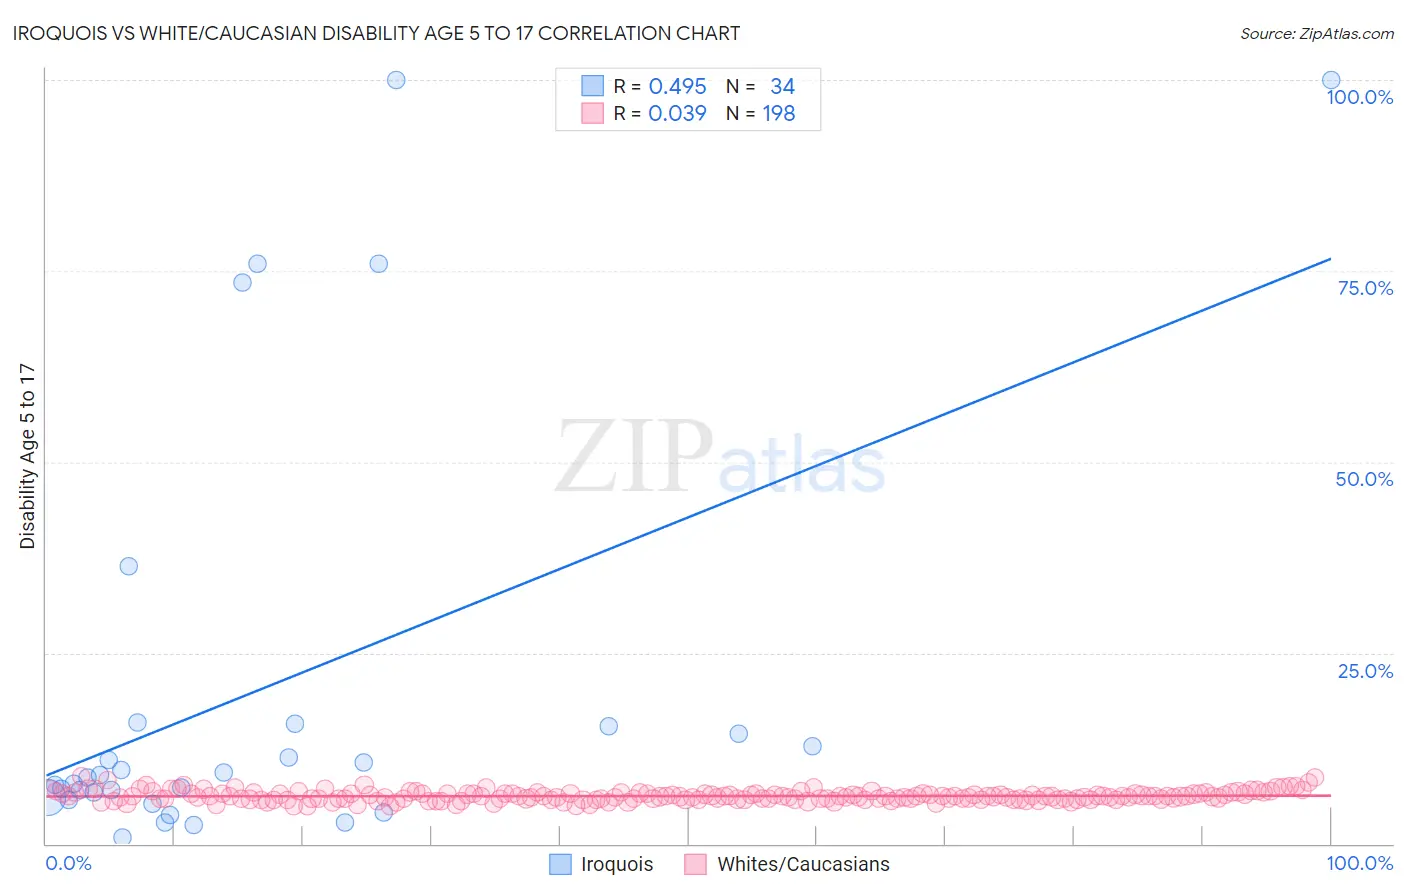
Iroquois vs White/Caucasian Disability Age 5 to 17 Correlation Chart
The statistical analysis conducted on geographies consisting of 206,302,830 people shows a moderate positive correlation between the proportion of Iroquois and percentage of population with a disability between the ages 5 and 17 in the United States with a correlation coefficient (R) of 0.495 and weighted average of 6.9%. Similarly, the statistical analysis conducted on geographies consisting of 566,464,467 people shows no correlation between the proportion of Whites/Caucasians and percentage of population with a disability between the ages 5 and 17 in the United States with a correlation coefficient (R) of 0.039 and weighted average of 6.2%, a difference of 11.1%.
Disability Age 5 to 17 Correlation Summary
| Measurement | Iroquois | White/Caucasian |
| Minimum | 0.85% | 4.9% |
| Maximum | 100.0% | 8.8% |
| Range | 99.1% | 4.0% |
| Mean | 20.3% | 6.2% |
| Median | 8.9% | 6.2% |
| Interquartile 25% (IQ1) | 6.0% | 5.8% |
| Interquartile 75% (IQ3) | 15.4% | 6.6% |
| Interquartile Range (IQR) | 9.3% | 0.72% |
| Standard Deviation (Sample) | 28.4% | 0.66% |
| Standard Deviation (Population) | 28.0% | 0.66% |
Similar Demographics by Disability Age 5 to 17
Demographics Similar to Iroquois by Disability Age 5 to 17
In terms of disability age 5 to 17, the demographic groups most similar to Iroquois are Creek (6.9%, a difference of 0.24%), Choctaw (6.9%, a difference of 0.33%), Cherokee (6.9%, a difference of 0.59%), Chickasaw (6.8%, a difference of 0.68%), and Cape Verdean (7.0%, a difference of 1.1%).
| Demographics | Rating | Rank | Disability Age 5 to 17 |
| French Canadians | 0.0 /100 | #331 | Tragic 6.7% |
| Immigrants | Azores | 0.0 /100 | #332 | Tragic 6.7% |
| Blacks/African Americans | 0.0 /100 | #333 | Tragic 6.8% |
| Seminole | 0.0 /100 | #334 | Tragic 6.8% |
| Ottawa | 0.0 /100 | #335 | Tragic 6.8% |
| Chickasaw | 0.0 /100 | #336 | Tragic 6.8% |
| Creek | 0.0 /100 | #337 | Tragic 6.9% |
| Iroquois | 0.0 /100 | #338 | Tragic 6.9% |
| Choctaw | 0.0 /100 | #339 | Tragic 6.9% |
| Cherokee | 0.0 /100 | #340 | Tragic 6.9% |
| Cape Verdeans | 0.0 /100 | #341 | Tragic 7.0% |
| Chippewa | 0.0 /100 | #342 | Tragic 7.1% |
| Immigrants | Cabo Verde | 0.0 /100 | #343 | Tragic 7.1% |
| Cajuns | 0.0 /100 | #344 | Tragic 7.2% |
| Tsimshian | 0.0 /100 | #345 | Tragic 7.9% |
Demographics Similar to Whites/Caucasians by Disability Age 5 to 17
In terms of disability age 5 to 17, the demographic groups most similar to Whites/Caucasians are Jamaican (6.2%, a difference of 0.15%), Yaqui (6.2%, a difference of 0.15%), Immigrants from Congo (6.2%, a difference of 0.15%), Immigrants from Senegal (6.2%, a difference of 0.24%), and Central American Indian (6.2%, a difference of 0.26%).
| Demographics | Rating | Rank | Disability Age 5 to 17 |
| Sub-Saharan Africans | 0.0 /100 | #284 | Tragic 6.2% |
| English | 0.0 /100 | #285 | Tragic 6.2% |
| Colville | 0.0 /100 | #286 | Tragic 6.2% |
| Pima | 0.0 /100 | #287 | Tragic 6.2% |
| Jamaicans | 0.0 /100 | #288 | Tragic 6.2% |
| Yaqui | 0.0 /100 | #289 | Tragic 6.2% |
| Immigrants | Congo | 0.0 /100 | #290 | Tragic 6.2% |
| Whites/Caucasians | 0.0 /100 | #291 | Tragic 6.2% |
| Immigrants | Senegal | 0.0 /100 | #292 | Tragic 6.2% |
| Central American Indians | 0.0 /100 | #293 | Tragic 6.2% |
| Irish | 0.0 /100 | #294 | Tragic 6.2% |
| Cree | 0.0 /100 | #295 | Tragic 6.2% |
| Spanish Americans | 0.0 /100 | #296 | Tragic 6.2% |
| Immigrants | Bahamas | 0.0 /100 | #297 | Tragic 6.2% |
| Lumbee | 0.0 /100 | #298 | Tragic 6.2% |