Iroquois vs Slavic College, Under 1 year
COMPARE
Iroquois
Slavic
College, Under 1 year
College, Under 1 year Comparison
Iroquois
Slavs
62.6%
COLLEGE, UNDER 1 YEAR
2.0/ 100
METRIC RATING
233rd/ 347
METRIC RANK
66.7%
COLLEGE, UNDER 1 YEAR
85.9/ 100
METRIC RATING
140th/ 347
METRIC RANK
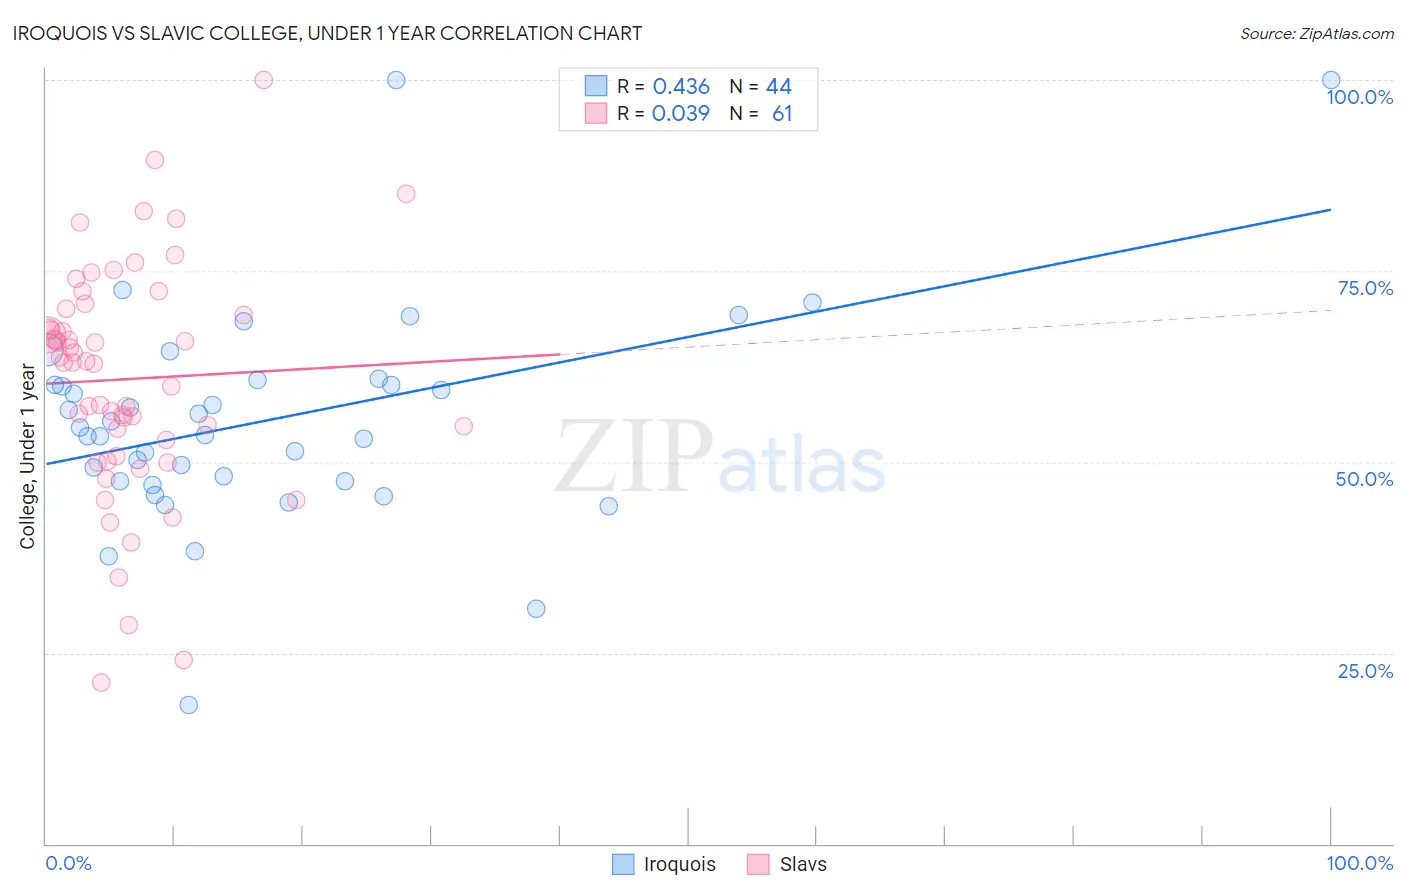
Iroquois vs Slavic College, Under 1 year Correlation Chart
The statistical analysis conducted on geographies consisting of 207,308,653 people shows a moderate positive correlation between the proportion of Iroquois and percentage of population with at least college, under 1 year education in the United States with a correlation coefficient (R) of 0.436 and weighted average of 62.6%. Similarly, the statistical analysis conducted on geographies consisting of 270,867,455 people shows no correlation between the proportion of Slavs and percentage of population with at least college, under 1 year education in the United States with a correlation coefficient (R) of 0.039 and weighted average of 66.7%, a difference of 6.5%.
College, Under 1 year Correlation Summary
| Measurement | Iroquois | Slavic |
| Minimum | 18.2% | 21.0% |
| Maximum | 100.0% | 100.0% |
| Range | 81.8% | 79.0% |
| Mean | 55.5% | 60.8% |
| Median | 54.0% | 63.0% |
| Interquartile 25% (IQ1) | 47.4% | 51.8% |
| Interquartile 75% (IQ3) | 60.4% | 69.7% |
| Interquartile Range (IQR) | 13.0% | 17.9% |
| Standard Deviation (Sample) | 14.4% | 15.1% |
| Standard Deviation (Population) | 14.3% | 14.9% |
Similar Demographics by College, Under 1 year
Demographics Similar to Iroquois by College, Under 1 year
In terms of college, under 1 year, the demographic groups most similar to Iroquois are Chippewa (62.6%, a difference of 0.030%), Spanish American (62.6%, a difference of 0.080%), Osage (62.7%, a difference of 0.12%), Immigrants (62.5%, a difference of 0.21%), and Immigrants from Western Africa (62.8%, a difference of 0.22%).
| Demographics | Rating | Rank | College, Under 1 year |
| Immigrants | Colombia | 4.0 /100 | #226 | Tragic 63.1% |
| Immigrants | Ghana | 3.7 /100 | #227 | Tragic 63.1% |
| Samoans | 3.3 /100 | #228 | Tragic 63.0% |
| Liberians | 3.2 /100 | #229 | Tragic 63.0% |
| Immigrants | Nonimmigrants | 3.0 /100 | #230 | Tragic 62.9% |
| Immigrants | Western Africa | 2.4 /100 | #231 | Tragic 62.8% |
| Osage | 2.2 /100 | #232 | Tragic 62.7% |
| Iroquois | 2.0 /100 | #233 | Tragic 62.6% |
| Chippewa | 2.0 /100 | #234 | Tragic 62.6% |
| Spanish Americans | 1.9 /100 | #235 | Tragic 62.6% |
| Immigrants | Immigrants | 1.7 /100 | #236 | Tragic 62.5% |
| Immigrants | Burma/Myanmar | 1.6 /100 | #237 | Tragic 62.5% |
| French American Indians | 1.5 /100 | #238 | Tragic 62.4% |
| Nepalese | 1.1 /100 | #239 | Tragic 62.2% |
| Aleuts | 1.1 /100 | #240 | Tragic 62.2% |
Demographics Similar to Slavs by College, Under 1 year
In terms of college, under 1 year, the demographic groups most similar to Slavs are Venezuelan (66.7%, a difference of 0.0%), Immigrants from Afghanistan (66.7%, a difference of 0.070%), Immigrants from Italy (66.8%, a difference of 0.10%), Immigrants from Chile (66.8%, a difference of 0.15%), and Ugandan (66.8%, a difference of 0.18%).
| Demographics | Rating | Rank | College, Under 1 year |
| Immigrants | Brazil | 88.3 /100 | #133 | Excellent 66.9% |
| Iraqis | 88.0 /100 | #134 | Excellent 66.8% |
| Canadians | 87.9 /100 | #135 | Excellent 66.8% |
| Ugandans | 87.8 /100 | #136 | Excellent 66.8% |
| Immigrants | Chile | 87.4 /100 | #137 | Excellent 66.8% |
| Immigrants | Italy | 86.9 /100 | #138 | Excellent 66.8% |
| Venezuelans | 85.9 /100 | #139 | Excellent 66.7% |
| Slavs | 85.9 /100 | #140 | Excellent 66.7% |
| Immigrants | Afghanistan | 85.1 /100 | #141 | Excellent 66.7% |
| English | 82.9 /100 | #142 | Excellent 66.6% |
| Immigrants | Uganda | 82.8 /100 | #143 | Excellent 66.5% |
| Immigrants | Germany | 82.0 /100 | #144 | Excellent 66.5% |
| Immigrants | Kenya | 81.8 /100 | #145 | Excellent 66.5% |
| Kenyans | 81.7 /100 | #146 | Excellent 66.5% |
| Immigrants | Morocco | 81.7 /100 | #147 | Excellent 66.5% |