Irish vs Ottawa Median Male Earnings
COMPARE
Irish
Ottawa
Median Male Earnings
Median Male Earnings Comparison
Irish
Ottawa
$56,464
MEDIAN MALE EARNINGS
87.4/ 100
METRIC RATING
135th/ 347
METRIC RANK
$46,611
MEDIAN MALE EARNINGS
0.0/ 100
METRIC RATING
308th/ 347
METRIC RANK
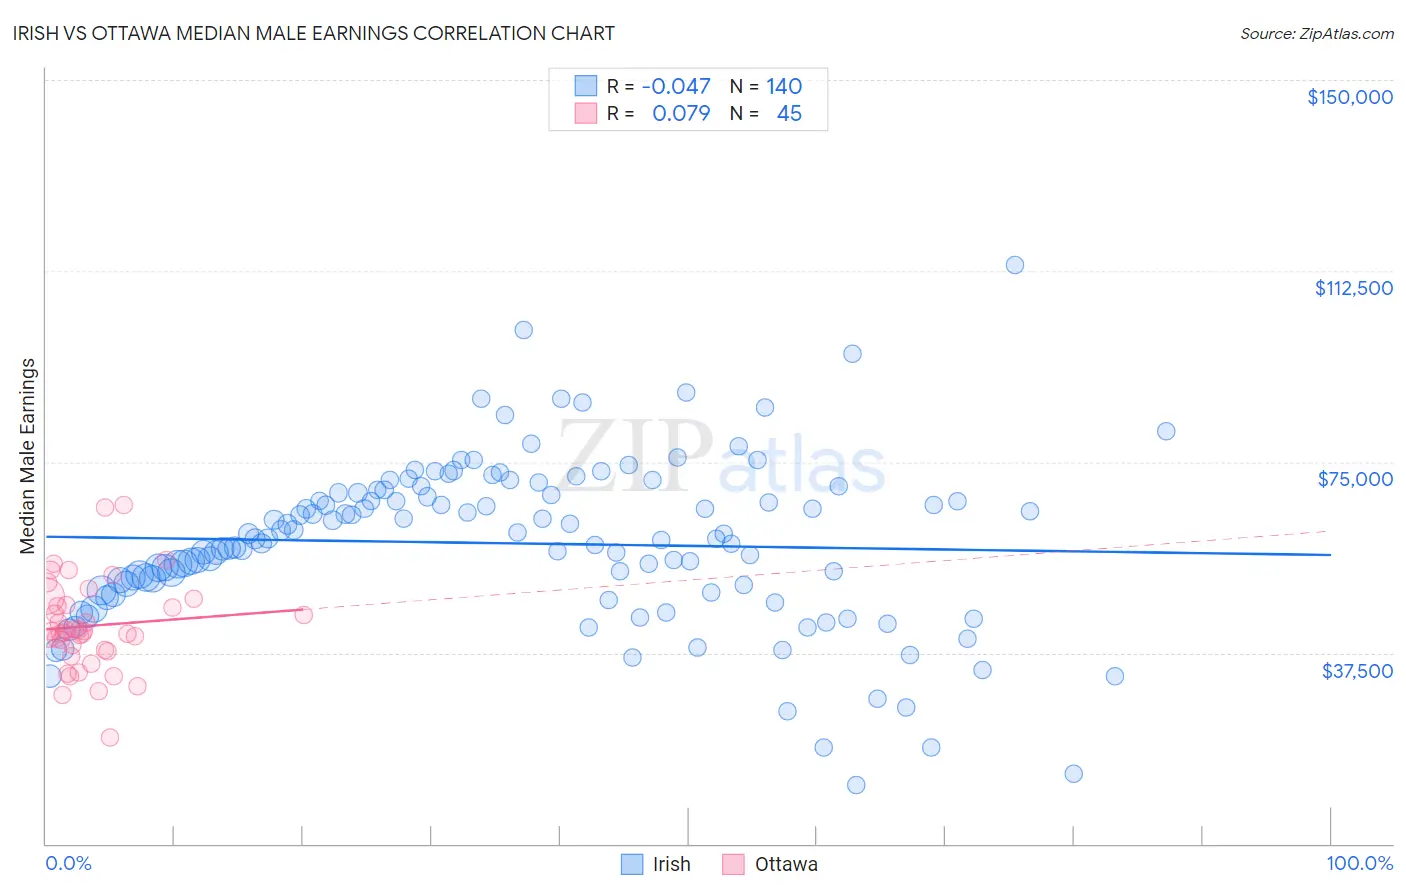
Irish vs Ottawa Median Male Earnings Correlation Chart
The statistical analysis conducted on geographies consisting of 578,544,263 people shows no correlation between the proportion of Irish and median male earnings in the United States with a correlation coefficient (R) of -0.047 and weighted average of $56,464. Similarly, the statistical analysis conducted on geographies consisting of 49,954,818 people shows a slight positive correlation between the proportion of Ottawa and median male earnings in the United States with a correlation coefficient (R) of 0.079 and weighted average of $46,611, a difference of 21.1%.
Median Male Earnings Correlation Summary
| Measurement | Irish | Ottawa |
| Minimum | $11,458 | $20,938 |
| Maximum | $113,788 | $66,563 |
| Range | $102,330 | $45,625 |
| Mean | $59,014 | $42,823 |
| Median | $59,889 | $41,768 |
| Interquartile 25% (IQ1) | $49,565 | $37,908 |
| Interquartile 75% (IQ3) | $68,949 | $47,441 |
| Interquartile Range (IQR) | $19,384 | $9,533 |
| Standard Deviation (Sample) | $16,409 | $8,970 |
| Standard Deviation (Population) | $16,350 | $8,870 |
Similar Demographics by Median Male Earnings
Demographics Similar to Irish by Median Male Earnings
In terms of median male earnings, the demographic groups most similar to Irish are Immigrants from Saudi Arabia ($56,452, a difference of 0.020%), Moroccan ($56,499, a difference of 0.060%), Slavic ($56,390, a difference of 0.13%), Czech ($56,546, a difference of 0.14%), and Immigrants from Germany ($56,542, a difference of 0.14%).
| Demographics | Rating | Rank | Median Male Earnings |
| Immigrants | Syria | 90.8 /100 | #128 | Exceptional $56,830 |
| Pakistanis | 89.9 /100 | #129 | Excellent $56,719 |
| Koreans | 89.4 /100 | #130 | Excellent $56,672 |
| Portuguese | 89.4 /100 | #131 | Excellent $56,663 |
| Czechs | 88.2 /100 | #132 | Excellent $56,546 |
| Immigrants | Germany | 88.2 /100 | #133 | Excellent $56,542 |
| Moroccans | 87.7 /100 | #134 | Excellent $56,499 |
| Irish | 87.4 /100 | #135 | Excellent $56,464 |
| Immigrants | Saudi Arabia | 87.2 /100 | #136 | Excellent $56,452 |
| Slavs | 86.5 /100 | #137 | Excellent $56,390 |
| Slovaks | 85.5 /100 | #138 | Excellent $56,306 |
| Zimbabweans | 85.5 /100 | #139 | Excellent $56,302 |
| Luxembourgers | 85.5 /100 | #140 | Excellent $56,300 |
| Danes | 84.8 /100 | #141 | Excellent $56,246 |
| Ethiopians | 84.8 /100 | #142 | Excellent $56,243 |
Demographics Similar to Ottawa by Median Male Earnings
In terms of median male earnings, the demographic groups most similar to Ottawa are Creek ($46,594, a difference of 0.040%), Cuban ($46,580, a difference of 0.070%), Immigrants from Dominican Republic ($46,655, a difference of 0.090%), Dutch West Indian ($46,656, a difference of 0.10%), and Guatemalan ($46,736, a difference of 0.27%).
| Demographics | Rating | Rank | Median Male Earnings |
| Immigrants | Latin America | 0.1 /100 | #301 | Tragic $46,941 |
| Seminole | 0.1 /100 | #302 | Tragic $46,783 |
| Yaqui | 0.1 /100 | #303 | Tragic $46,777 |
| Bangladeshis | 0.1 /100 | #304 | Tragic $46,744 |
| Guatemalans | 0.0 /100 | #305 | Tragic $46,736 |
| Dutch West Indians | 0.0 /100 | #306 | Tragic $46,656 |
| Immigrants | Dominican Republic | 0.0 /100 | #307 | Tragic $46,655 |
| Ottawa | 0.0 /100 | #308 | Tragic $46,611 |
| Creek | 0.0 /100 | #309 | Tragic $46,594 |
| Cubans | 0.0 /100 | #310 | Tragic $46,580 |
| Apache | 0.0 /100 | #311 | Tragic $46,429 |
| Hispanics or Latinos | 0.0 /100 | #312 | Tragic $46,419 |
| Hondurans | 0.0 /100 | #313 | Tragic $46,374 |
| Chippewa | 0.0 /100 | #314 | Tragic $46,368 |
| Immigrants | Guatemala | 0.0 /100 | #315 | Tragic $46,244 |