Iranian vs Central American Self-Care Disability
COMPARE
Iranian
Central American
Self-Care Disability
Self-Care Disability Comparison
Iranians
Central Americans
2.3%
SELF-CARE DISABILITY
99.8/ 100
METRIC RATING
40th/ 347
METRIC RANK
2.5%
SELF-CARE DISABILITY
8.7/ 100
METRIC RATING
208th/ 347
METRIC RANK
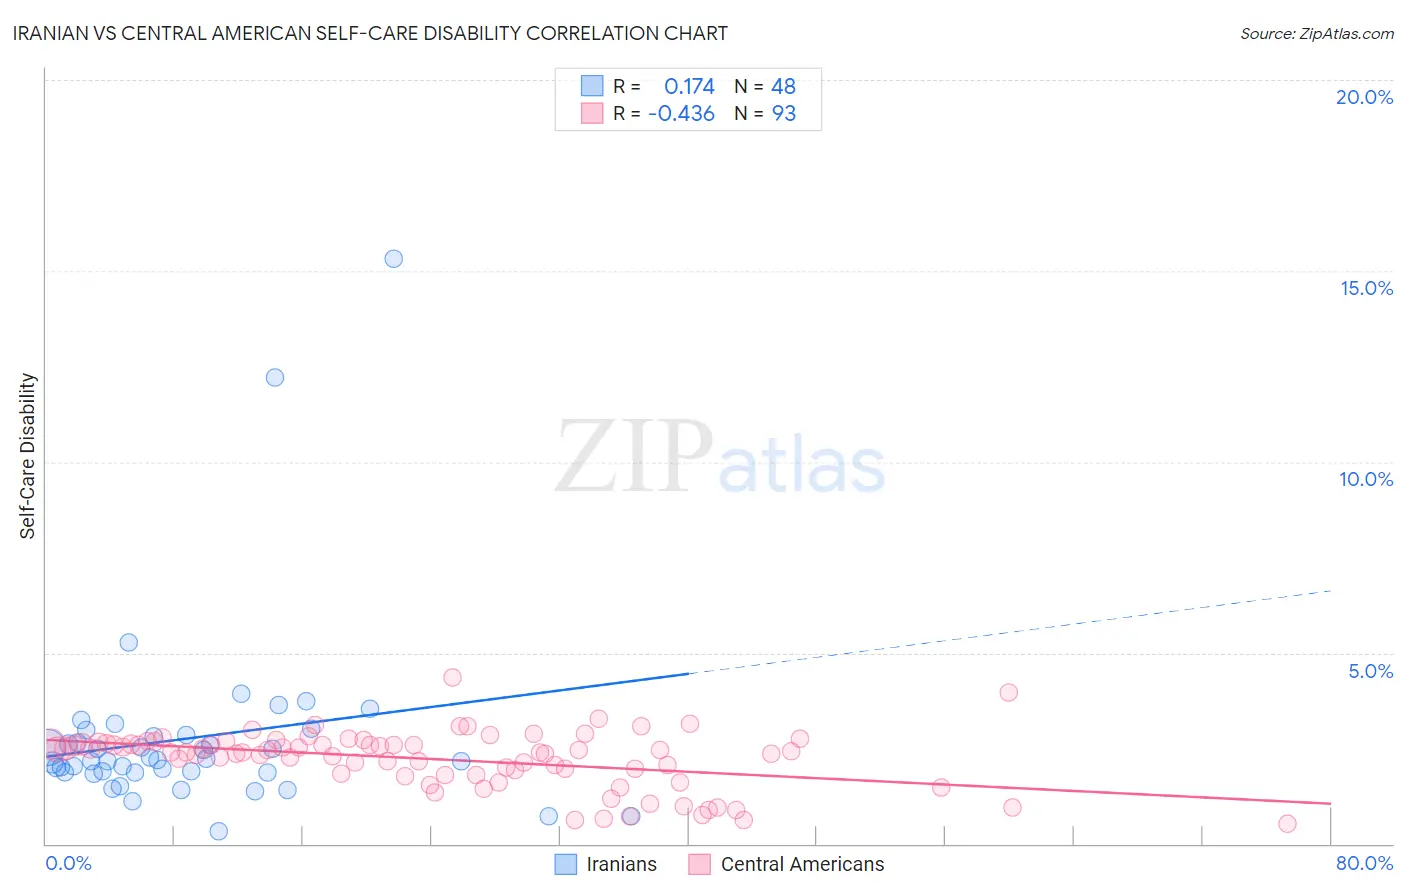
Iranian vs Central American Self-Care Disability Correlation Chart
The statistical analysis conducted on geographies consisting of 316,529,942 people shows a poor positive correlation between the proportion of Iranians and percentage of population with self-care disability in the United States with a correlation coefficient (R) of 0.174 and weighted average of 2.3%. Similarly, the statistical analysis conducted on geographies consisting of 503,524,295 people shows a moderate negative correlation between the proportion of Central Americans and percentage of population with self-care disability in the United States with a correlation coefficient (R) of -0.436 and weighted average of 2.5%, a difference of 11.3%.
Self-Care Disability Correlation Summary
| Measurement | Iranian | Central American |
| Minimum | 0.34% | 0.52% |
| Maximum | 15.3% | 4.3% |
| Range | 15.0% | 3.8% |
| Mean | 2.8% | 2.2% |
| Median | 2.2% | 2.4% |
| Interquartile 25% (IQ1) | 1.9% | 1.8% |
| Interquartile 75% (IQ3) | 2.8% | 2.6% |
| Interquartile Range (IQR) | 0.97% | 0.81% |
| Standard Deviation (Sample) | 2.5% | 0.74% |
| Standard Deviation (Population) | 2.5% | 0.73% |
Similar Demographics by Self-Care Disability
Demographics Similar to Iranians by Self-Care Disability
In terms of self-care disability, the demographic groups most similar to Iranians are Immigrants from Bulgaria (2.3%, a difference of 0.040%), Immigrants from Sudan (2.3%, a difference of 0.070%), Immigrants from Eastern Africa (2.3%, a difference of 0.15%), Immigrants from Uganda (2.3%, a difference of 0.17%), and Immigrants from Pakistan (2.3%, a difference of 0.21%).
| Demographics | Rating | Rank | Self-Care Disability |
| Immigrants | Korea | 99.9 /100 | #33 | Exceptional 2.3% |
| Immigrants | Turkey | 99.9 /100 | #34 | Exceptional 2.3% |
| Immigrants | Australia | 99.9 /100 | #35 | Exceptional 2.3% |
| Immigrants | Lithuania | 99.9 /100 | #36 | Exceptional 2.3% |
| Immigrants | Sweden | 99.9 /100 | #37 | Exceptional 2.3% |
| Immigrants | Eastern Africa | 99.9 /100 | #38 | Exceptional 2.3% |
| Immigrants | Bulgaria | 99.8 /100 | #39 | Exceptional 2.3% |
| Iranians | 99.8 /100 | #40 | Exceptional 2.3% |
| Immigrants | Sudan | 99.8 /100 | #41 | Exceptional 2.3% |
| Immigrants | Uganda | 99.8 /100 | #42 | Exceptional 2.3% |
| Immigrants | Pakistan | 99.8 /100 | #43 | Exceptional 2.3% |
| Immigrants | South Africa | 99.8 /100 | #44 | Exceptional 2.3% |
| Norwegians | 99.8 /100 | #45 | Exceptional 2.3% |
| Czechs | 99.8 /100 | #46 | Exceptional 2.3% |
| Jordanians | 99.7 /100 | #47 | Exceptional 2.3% |
Demographics Similar to Central Americans by Self-Care Disability
In terms of self-care disability, the demographic groups most similar to Central Americans are Malaysian (2.5%, a difference of 0.15%), French (2.5%, a difference of 0.16%), Alaskan Athabascan (2.5%, a difference of 0.23%), Immigrants from Russia (2.5%, a difference of 0.31%), and Panamanian (2.5%, a difference of 0.38%).
| Demographics | Rating | Rank | Self-Care Disability |
| Immigrants | South Eastern Asia | 12.9 /100 | #201 | Poor 2.5% |
| Slovaks | 12.6 /100 | #202 | Poor 2.5% |
| Immigrants | Lebanon | 12.4 /100 | #203 | Poor 2.5% |
| Immigrants | Bahamas | 11.9 /100 | #204 | Poor 2.5% |
| Immigrants | Russia | 11.0 /100 | #205 | Poor 2.5% |
| Alaskan Athabascans | 10.4 /100 | #206 | Poor 2.5% |
| French | 9.9 /100 | #207 | Tragic 2.5% |
| Central Americans | 8.7 /100 | #208 | Tragic 2.5% |
| Malaysians | 7.7 /100 | #209 | Tragic 2.5% |
| Panamanians | 6.4 /100 | #210 | Tragic 2.5% |
| Native Hawaiians | 5.1 /100 | #211 | Tragic 2.6% |
| Samoans | 5.1 /100 | #212 | Tragic 2.6% |
| Ecuadorians | 4.7 /100 | #213 | Tragic 2.6% |
| Immigrants | Honduras | 4.7 /100 | #214 | Tragic 2.6% |
| Immigrants | Thailand | 4.5 /100 | #215 | Tragic 2.6% |