Iranian vs Central American Disability
COMPARE
Iranian
Central American
Disability
Disability Comparison
Iranians
Central Americans
10.1%
DISABILITY
100.0/ 100
METRIC RATING
11th/ 347
METRIC RANK
11.4%
DISABILITY
93.5/ 100
METRIC RATING
119th/ 347
METRIC RANK
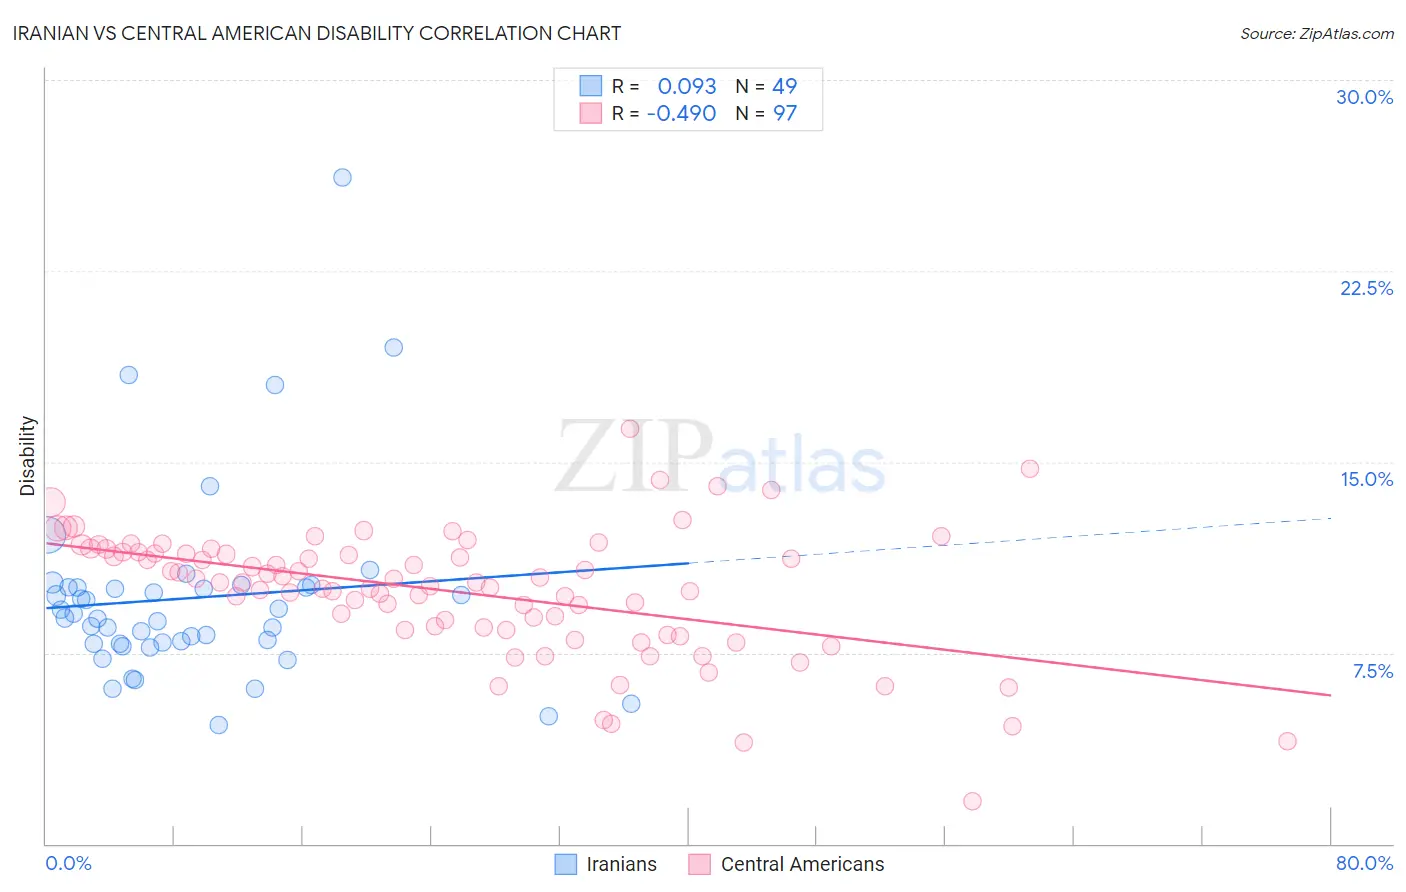
Iranian vs Central American Disability Correlation Chart
The statistical analysis conducted on geographies consisting of 316,882,052 people shows a slight positive correlation between the proportion of Iranians and percentage of population with a disability in the United States with a correlation coefficient (R) of 0.093 and weighted average of 10.1%. Similarly, the statistical analysis conducted on geographies consisting of 504,498,688 people shows a moderate negative correlation between the proportion of Central Americans and percentage of population with a disability in the United States with a correlation coefficient (R) of -0.490 and weighted average of 11.4%, a difference of 12.3%.
Disability Correlation Summary
| Measurement | Iranian | Central American |
| Minimum | 4.6% | 1.6% |
| Maximum | 26.2% | 16.3% |
| Range | 21.5% | 14.6% |
| Mean | 9.7% | 9.9% |
| Median | 8.9% | 10.3% |
| Interquartile 25% (IQ1) | 7.9% | 8.5% |
| Interquartile 75% (IQ3) | 10.1% | 11.4% |
| Interquartile Range (IQR) | 2.2% | 3.0% |
| Standard Deviation (Sample) | 3.8% | 2.5% |
| Standard Deviation (Population) | 3.8% | 2.5% |
Similar Demographics by Disability
Demographics Similar to Iranians by Disability
In terms of disability, the demographic groups most similar to Iranians are Immigrants from China (10.1%, a difference of 0.010%), Immigrants from Israel (10.1%, a difference of 0.25%), Immigrants from Eastern Asia (10.2%, a difference of 0.46%), Immigrants from Hong Kong (10.0%, a difference of 0.82%), and Immigrants from Korea (10.2%, a difference of 1.1%).
| Demographics | Rating | Rank | Disability |
| Thais | 100.0 /100 | #4 | Exceptional 9.7% |
| Immigrants | Bolivia | 100.0 /100 | #5 | Exceptional 9.9% |
| Immigrants | South Central Asia | 100.0 /100 | #6 | Exceptional 9.9% |
| Immigrants | Singapore | 100.0 /100 | #7 | Exceptional 10.0% |
| Bolivians | 100.0 /100 | #8 | Exceptional 10.0% |
| Immigrants | Hong Kong | 100.0 /100 | #9 | Exceptional 10.0% |
| Immigrants | China | 100.0 /100 | #10 | Exceptional 10.1% |
| Iranians | 100.0 /100 | #11 | Exceptional 10.1% |
| Immigrants | Israel | 100.0 /100 | #12 | Exceptional 10.1% |
| Immigrants | Eastern Asia | 100.0 /100 | #13 | Exceptional 10.2% |
| Immigrants | Korea | 100.0 /100 | #14 | Exceptional 10.2% |
| Okinawans | 100.0 /100 | #15 | Exceptional 10.3% |
| Indians (Asian) | 100.0 /100 | #16 | Exceptional 10.3% |
| Immigrants | Iran | 100.0 /100 | #17 | Exceptional 10.3% |
| Burmese | 100.0 /100 | #18 | Exceptional 10.4% |
Demographics Similar to Central Americans by Disability
In terms of disability, the demographic groups most similar to Central Americans are Immigrants from North Macedonia (11.4%, a difference of 0.0%), Immigrants from Costa Rica (11.4%, a difference of 0.010%), Brazilian (11.4%, a difference of 0.040%), Korean (11.3%, a difference of 0.050%), and Luxembourger (11.3%, a difference of 0.070%).
| Demographics | Rating | Rank | Disability |
| Immigrants | Uzbekistan | 94.9 /100 | #112 | Exceptional 11.3% |
| Guyanese | 94.7 /100 | #113 | Exceptional 11.3% |
| Immigrants | Syria | 94.7 /100 | #114 | Exceptional 11.3% |
| Immigrants | Philippines | 94.6 /100 | #115 | Exceptional 11.3% |
| Immigrants | Northern Europe | 94.1 /100 | #116 | Exceptional 11.3% |
| Luxembourgers | 93.9 /100 | #117 | Exceptional 11.3% |
| Koreans | 93.8 /100 | #118 | Exceptional 11.3% |
| Central Americans | 93.5 /100 | #119 | Exceptional 11.4% |
| Immigrants | North Macedonia | 93.5 /100 | #120 | Exceptional 11.4% |
| Immigrants | Costa Rica | 93.4 /100 | #121 | Exceptional 11.4% |
| Brazilians | 93.3 /100 | #122 | Exceptional 11.4% |
| South Africans | 92.3 /100 | #123 | Exceptional 11.4% |
| South American Indians | 92.2 /100 | #124 | Exceptional 11.4% |
| Costa Ricans | 91.9 /100 | #125 | Exceptional 11.4% |
| Immigrants | Latvia | 90.9 /100 | #126 | Exceptional 11.4% |