Immigrants from Congo vs Central American Self-Care Disability
COMPARE
Immigrants from Congo
Central American
Self-Care Disability
Self-Care Disability Comparison
Immigrants from Congo
Central Americans
2.4%
SELF-CARE DISABILITY
98.0/ 100
METRIC RATING
89th/ 347
METRIC RANK
2.5%
SELF-CARE DISABILITY
8.7/ 100
METRIC RATING
208th/ 347
METRIC RANK
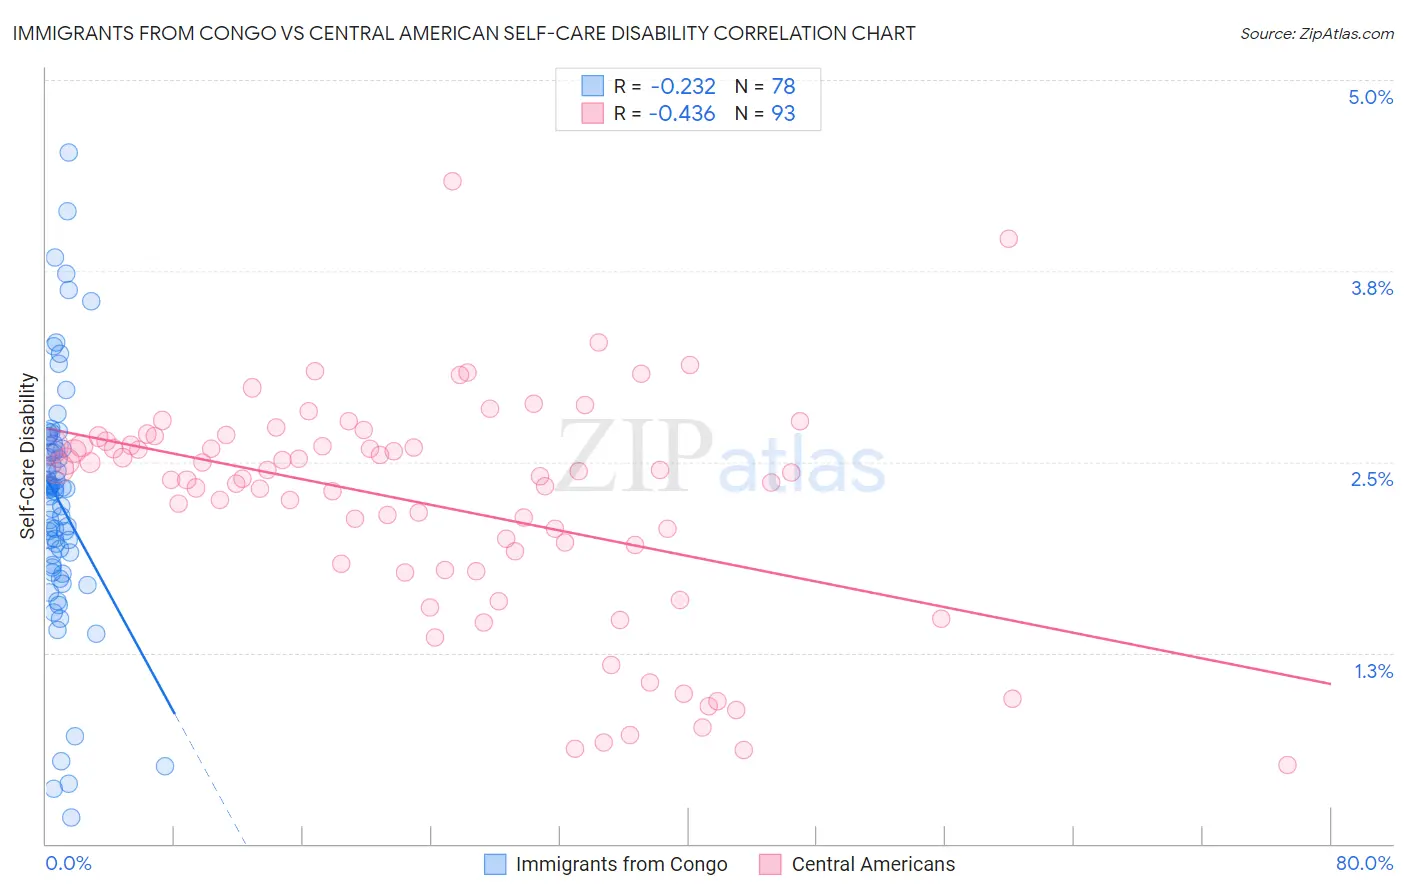
Immigrants from Congo vs Central American Self-Care Disability Correlation Chart
The statistical analysis conducted on geographies consisting of 92,100,672 people shows a weak negative correlation between the proportion of Immigrants from Congo and percentage of population with self-care disability in the United States with a correlation coefficient (R) of -0.232 and weighted average of 2.4%. Similarly, the statistical analysis conducted on geographies consisting of 503,524,295 people shows a moderate negative correlation between the proportion of Central Americans and percentage of population with self-care disability in the United States with a correlation coefficient (R) of -0.436 and weighted average of 2.5%, a difference of 7.8%.
Self-Care Disability Correlation Summary
| Measurement | Immigrants from Congo | Central American |
| Minimum | 0.17% | 0.52% |
| Maximum | 4.5% | 4.3% |
| Range | 4.4% | 3.8% |
| Mean | 2.2% | 2.2% |
| Median | 2.3% | 2.4% |
| Interquartile 25% (IQ1) | 1.8% | 1.8% |
| Interquartile 75% (IQ3) | 2.6% | 2.6% |
| Interquartile Range (IQR) | 0.76% | 0.81% |
| Standard Deviation (Sample) | 0.81% | 0.74% |
| Standard Deviation (Population) | 0.80% | 0.73% |
Similar Demographics by Self-Care Disability
Demographics Similar to Immigrants from Congo by Self-Care Disability
In terms of self-care disability, the demographic groups most similar to Immigrants from Congo are Sierra Leonean (2.4%, a difference of 0.050%), Lithuanian (2.4%, a difference of 0.050%), Immigrants from Czechoslovakia (2.4%, a difference of 0.14%), Immigrants from Jordan (2.4%, a difference of 0.15%), and Immigrants from Northern Africa (2.3%, a difference of 0.19%).
| Demographics | Rating | Rank | Self-Care Disability |
| Immigrants | Denmark | 98.8 /100 | #82 | Exceptional 2.3% |
| Indians (Asian) | 98.7 /100 | #83 | Exceptional 2.3% |
| Immigrants | Spain | 98.7 /100 | #84 | Exceptional 2.3% |
| Estonians | 98.3 /100 | #85 | Exceptional 2.3% |
| Immigrants | Northern Africa | 98.2 /100 | #86 | Exceptional 2.3% |
| Sierra Leoneans | 98.0 /100 | #87 | Exceptional 2.4% |
| Lithuanians | 98.0 /100 | #88 | Exceptional 2.4% |
| Immigrants | Congo | 98.0 /100 | #89 | Exceptional 2.4% |
| Immigrants | Czechoslovakia | 97.7 /100 | #90 | Exceptional 2.4% |
| Immigrants | Jordan | 97.7 /100 | #91 | Exceptional 2.4% |
| Icelanders | 97.4 /100 | #92 | Exceptional 2.4% |
| Immigrants | Latvia | 97.0 /100 | #93 | Exceptional 2.4% |
| Macedonians | 96.9 /100 | #94 | Exceptional 2.4% |
| Immigrants | Asia | 96.9 /100 | #95 | Exceptional 2.4% |
| Immigrants | Chile | 96.7 /100 | #96 | Exceptional 2.4% |
Demographics Similar to Central Americans by Self-Care Disability
In terms of self-care disability, the demographic groups most similar to Central Americans are Malaysian (2.5%, a difference of 0.15%), French (2.5%, a difference of 0.16%), Alaskan Athabascan (2.5%, a difference of 0.23%), Immigrants from Russia (2.5%, a difference of 0.31%), and Panamanian (2.5%, a difference of 0.38%).
| Demographics | Rating | Rank | Self-Care Disability |
| Immigrants | South Eastern Asia | 12.9 /100 | #201 | Poor 2.5% |
| Slovaks | 12.6 /100 | #202 | Poor 2.5% |
| Immigrants | Lebanon | 12.4 /100 | #203 | Poor 2.5% |
| Immigrants | Bahamas | 11.9 /100 | #204 | Poor 2.5% |
| Immigrants | Russia | 11.0 /100 | #205 | Poor 2.5% |
| Alaskan Athabascans | 10.4 /100 | #206 | Poor 2.5% |
| French | 9.9 /100 | #207 | Tragic 2.5% |
| Central Americans | 8.7 /100 | #208 | Tragic 2.5% |
| Malaysians | 7.7 /100 | #209 | Tragic 2.5% |
| Panamanians | 6.4 /100 | #210 | Tragic 2.5% |
| Native Hawaiians | 5.1 /100 | #211 | Tragic 2.6% |
| Samoans | 5.1 /100 | #212 | Tragic 2.6% |
| Ecuadorians | 4.7 /100 | #213 | Tragic 2.6% |
| Immigrants | Honduras | 4.7 /100 | #214 | Tragic 2.6% |
| Immigrants | Thailand | 4.5 /100 | #215 | Tragic 2.6% |