Iranian vs Sri Lankan Self-Care Disability
COMPARE
Iranian
Sri Lankan
Self-Care Disability
Self-Care Disability Comparison
Iranians
Sri Lankans
2.3%
SELF-CARE DISABILITY
99.8/ 100
METRIC RATING
40th/ 347
METRIC RANK
2.4%
SELF-CARE DISABILITY
86.6/ 100
METRIC RATING
139th/ 347
METRIC RANK
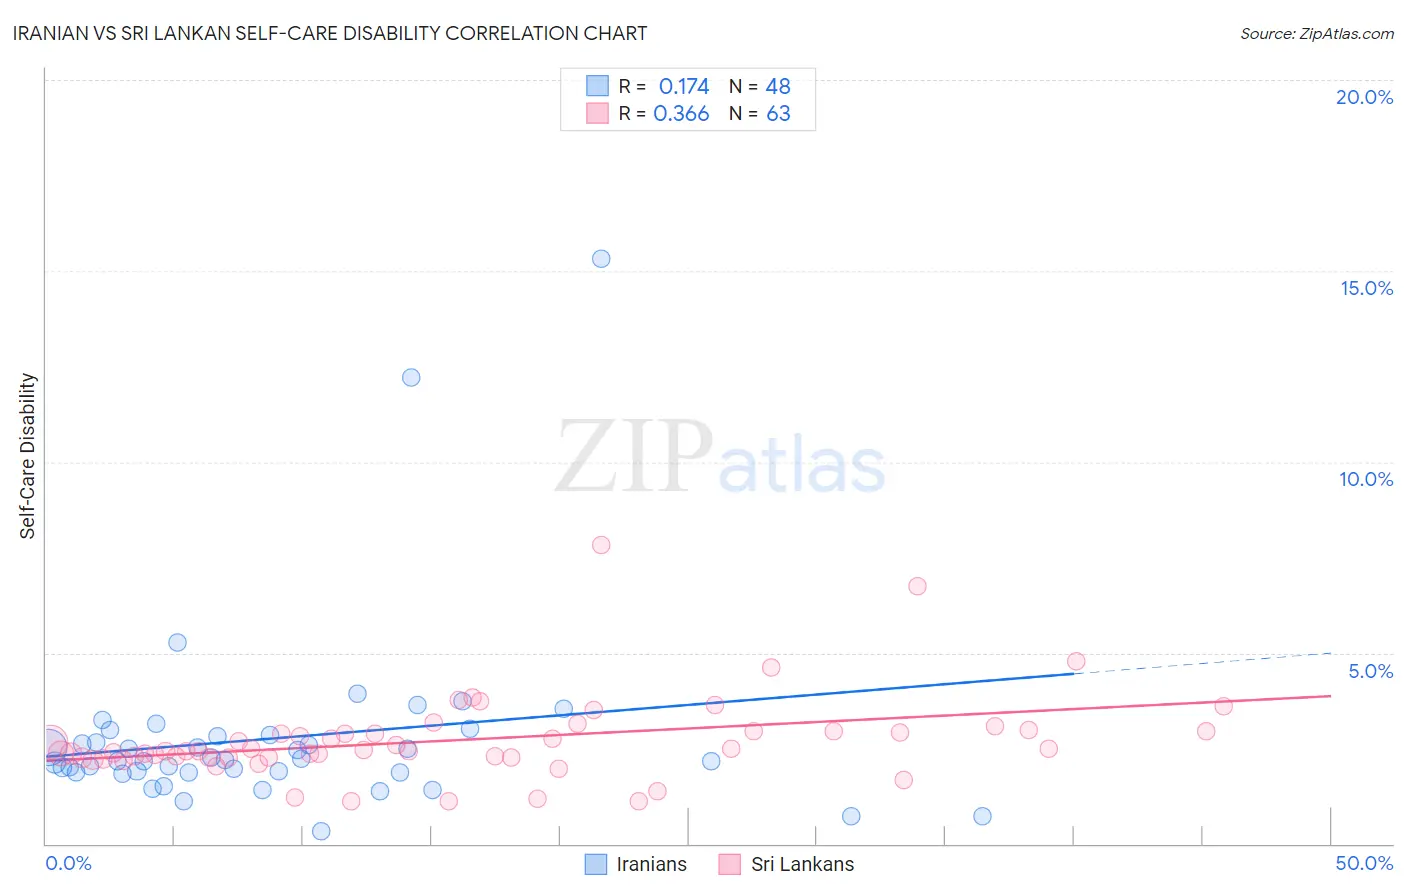
Iranian vs Sri Lankan Self-Care Disability Correlation Chart
The statistical analysis conducted on geographies consisting of 316,529,942 people shows a poor positive correlation between the proportion of Iranians and percentage of population with self-care disability in the United States with a correlation coefficient (R) of 0.174 and weighted average of 2.3%. Similarly, the statistical analysis conducted on geographies consisting of 439,764,256 people shows a mild positive correlation between the proportion of Sri Lankans and percentage of population with self-care disability in the United States with a correlation coefficient (R) of 0.366 and weighted average of 2.4%, a difference of 5.9%.
Self-Care Disability Correlation Summary
| Measurement | Iranian | Sri Lankan |
| Minimum | 0.34% | 1.1% |
| Maximum | 15.3% | 7.8% |
| Range | 15.0% | 6.7% |
| Mean | 2.8% | 2.7% |
| Median | 2.2% | 2.4% |
| Interquartile 25% (IQ1) | 1.9% | 2.3% |
| Interquartile 75% (IQ3) | 2.8% | 2.9% |
| Interquartile Range (IQR) | 0.97% | 0.68% |
| Standard Deviation (Sample) | 2.5% | 1.1% |
| Standard Deviation (Population) | 2.5% | 1.1% |
Similar Demographics by Self-Care Disability
Demographics Similar to Iranians by Self-Care Disability
In terms of self-care disability, the demographic groups most similar to Iranians are Immigrants from Bulgaria (2.3%, a difference of 0.040%), Immigrants from Sudan (2.3%, a difference of 0.070%), Immigrants from Eastern Africa (2.3%, a difference of 0.15%), Immigrants from Uganda (2.3%, a difference of 0.17%), and Immigrants from Pakistan (2.3%, a difference of 0.21%).
| Demographics | Rating | Rank | Self-Care Disability |
| Immigrants | Korea | 99.9 /100 | #33 | Exceptional 2.3% |
| Immigrants | Turkey | 99.9 /100 | #34 | Exceptional 2.3% |
| Immigrants | Australia | 99.9 /100 | #35 | Exceptional 2.3% |
| Immigrants | Lithuania | 99.9 /100 | #36 | Exceptional 2.3% |
| Immigrants | Sweden | 99.9 /100 | #37 | Exceptional 2.3% |
| Immigrants | Eastern Africa | 99.9 /100 | #38 | Exceptional 2.3% |
| Immigrants | Bulgaria | 99.8 /100 | #39 | Exceptional 2.3% |
| Iranians | 99.8 /100 | #40 | Exceptional 2.3% |
| Immigrants | Sudan | 99.8 /100 | #41 | Exceptional 2.3% |
| Immigrants | Uganda | 99.8 /100 | #42 | Exceptional 2.3% |
| Immigrants | Pakistan | 99.8 /100 | #43 | Exceptional 2.3% |
| Immigrants | South Africa | 99.8 /100 | #44 | Exceptional 2.3% |
| Norwegians | 99.8 /100 | #45 | Exceptional 2.3% |
| Czechs | 99.8 /100 | #46 | Exceptional 2.3% |
| Jordanians | 99.7 /100 | #47 | Exceptional 2.3% |
Demographics Similar to Sri Lankans by Self-Care Disability
In terms of self-care disability, the demographic groups most similar to Sri Lankans are Immigrants from Croatia (2.4%, a difference of 0.0%), Austrian (2.4%, a difference of 0.050%), South American Indian (2.4%, a difference of 0.070%), Immigrants from Uruguay (2.4%, a difference of 0.12%), and Laotian (2.4%, a difference of 0.13%).
| Demographics | Rating | Rank | Self-Care Disability |
| Immigrants | South America | 88.8 /100 | #132 | Excellent 2.4% |
| Immigrants | Colombia | 88.5 /100 | #133 | Excellent 2.4% |
| Russians | 88.2 /100 | #134 | Excellent 2.4% |
| Laotians | 87.8 /100 | #135 | Excellent 2.4% |
| South American Indians | 87.2 /100 | #136 | Excellent 2.4% |
| Austrians | 87.0 /100 | #137 | Excellent 2.4% |
| Immigrants | Croatia | 86.6 /100 | #138 | Excellent 2.4% |
| Sri Lankans | 86.6 /100 | #139 | Excellent 2.4% |
| Immigrants | Uruguay | 85.4 /100 | #140 | Excellent 2.4% |
| Alaska Natives | 84.5 /100 | #141 | Excellent 2.4% |
| Immigrants | Peru | 83.2 /100 | #142 | Excellent 2.4% |
| Afghans | 82.3 /100 | #143 | Excellent 2.4% |
| Costa Ricans | 80.8 /100 | #144 | Excellent 2.4% |
| Germans | 80.1 /100 | #145 | Excellent 2.4% |
| Israelis | 80.0 /100 | #146 | Good 2.4% |