Inupiat vs Finnish Disability Age 5 to 17
COMPARE
Inupiat
Finnish
Disability Age 5 to 17
Disability Age 5 to 17 Comparison
Inupiat
Finns
5.7%
DISABILITY AGE 5 TO 17
23.3/ 100
METRIC RATING
196th/ 347
METRIC RANK
6.0%
DISABILITY AGE 5 TO 17
0.2/ 100
METRIC RATING
272nd/ 347
METRIC RANK
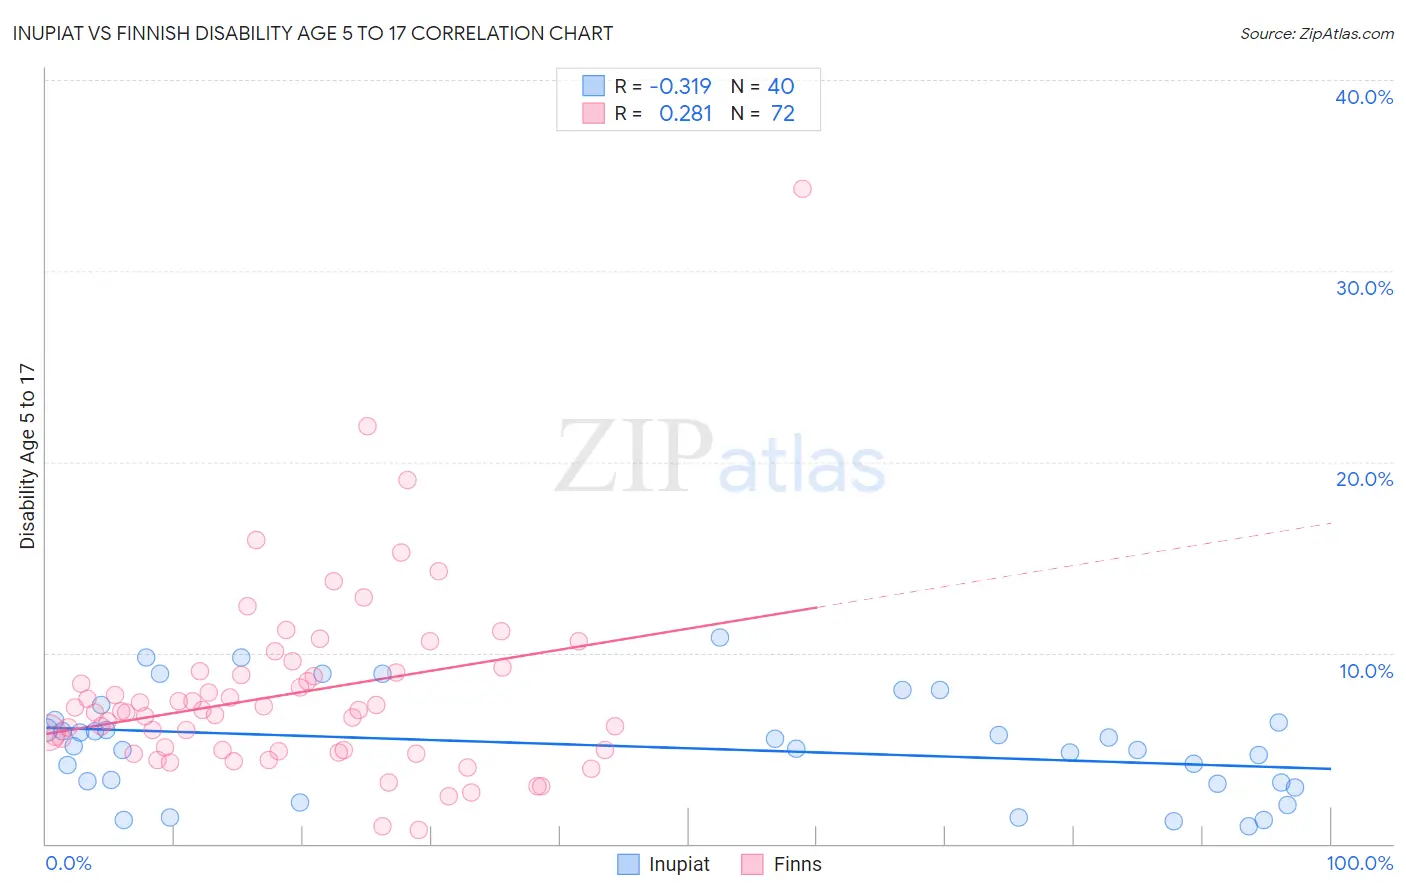
Inupiat vs Finnish Disability Age 5 to 17 Correlation Chart
The statistical analysis conducted on geographies consisting of 96,104,809 people shows a mild negative correlation between the proportion of Inupiat and percentage of population with a disability between the ages 5 and 17 in the United States with a correlation coefficient (R) of -0.319 and weighted average of 5.7%. Similarly, the statistical analysis conducted on geographies consisting of 400,280,382 people shows a weak positive correlation between the proportion of Finns and percentage of population with a disability between the ages 5 and 17 in the United States with a correlation coefficient (R) of 0.281 and weighted average of 6.0%, a difference of 6.1%.
Disability Age 5 to 17 Correlation Summary
| Measurement | Inupiat | Finnish |
| Minimum | 0.93% | 0.71% |
| Maximum | 10.8% | 34.3% |
| Range | 9.9% | 33.6% |
| Mean | 5.1% | 7.9% |
| Median | 5.1% | 7.0% |
| Interquartile 25% (IQ1) | 3.2% | 4.9% |
| Interquartile 75% (IQ3) | 6.4% | 9.0% |
| Interquartile Range (IQR) | 3.3% | 4.1% |
| Standard Deviation (Sample) | 2.7% | 5.0% |
| Standard Deviation (Population) | 2.6% | 4.9% |
Similar Demographics by Disability Age 5 to 17
Demographics Similar to Inupiat by Disability Age 5 to 17
In terms of disability age 5 to 17, the demographic groups most similar to Inupiat are Immigrants from Nigeria (5.7%, a difference of 0.010%), Immigrants from North America (5.7%, a difference of 0.010%), Croatian (5.7%, a difference of 0.020%), Norwegian (5.7%, a difference of 0.17%), and Immigrants from Canada (5.7%, a difference of 0.18%).
| Demographics | Rating | Rank | Disability Age 5 to 17 |
| Pueblo | 27.5 /100 | #189 | Fair 5.7% |
| Immigrants | Eastern Africa | 27.3 /100 | #190 | Fair 5.7% |
| Danes | 26.5 /100 | #191 | Fair 5.7% |
| Immigrants | Bosnia and Herzegovina | 26.3 /100 | #192 | Fair 5.7% |
| Immigrants | Canada | 26.1 /100 | #193 | Fair 5.7% |
| Croatians | 23.6 /100 | #194 | Fair 5.7% |
| Immigrants | Nigeria | 23.4 /100 | #195 | Fair 5.7% |
| Inupiat | 23.3 /100 | #196 | Fair 5.7% |
| Immigrants | North America | 23.1 /100 | #197 | Fair 5.7% |
| Norwegians | 20.9 /100 | #198 | Fair 5.7% |
| Northern Europeans | 15.2 /100 | #199 | Poor 5.7% |
| Icelanders | 14.6 /100 | #200 | Poor 5.7% |
| Basques | 13.7 /100 | #201 | Poor 5.7% |
| Austrians | 13.2 /100 | #202 | Poor 5.7% |
| Spanish American Indians | 12.8 /100 | #203 | Poor 5.7% |
Demographics Similar to Finns by Disability Age 5 to 17
In terms of disability age 5 to 17, the demographic groups most similar to Finns are Immigrants from Zaire (6.0%, a difference of 0.030%), Alaska Native (6.0%, a difference of 0.050%), Cheyenne (6.0%, a difference of 0.16%), Dutch (6.0%, a difference of 0.27%), and Japanese (6.1%, a difference of 0.38%).
| Demographics | Rating | Rank | Disability Age 5 to 17 |
| Panamanians | 0.6 /100 | #265 | Tragic 6.0% |
| Slovenes | 0.6 /100 | #266 | Tragic 6.0% |
| Spanish | 0.5 /100 | #267 | Tragic 6.0% |
| Sioux | 0.4 /100 | #268 | Tragic 6.0% |
| Liberians | 0.4 /100 | #269 | Tragic 6.0% |
| Immigrants | Somalia | 0.4 /100 | #270 | Tragic 6.0% |
| Immigrants | Zaire | 0.2 /100 | #271 | Tragic 6.0% |
| Finns | 0.2 /100 | #272 | Tragic 6.0% |
| Alaska Natives | 0.2 /100 | #273 | Tragic 6.0% |
| Cheyenne | 0.2 /100 | #274 | Tragic 6.0% |
| Dutch | 0.2 /100 | #275 | Tragic 6.0% |
| Japanese | 0.1 /100 | #276 | Tragic 6.1% |
| Puget Sound Salish | 0.1 /100 | #277 | Tragic 6.1% |
| Immigrants | Liberia | 0.1 /100 | #278 | Tragic 6.1% |
| Immigrants | Jamaica | 0.1 /100 | #279 | Tragic 6.1% |