Immigrants from Italy vs Scotch-Irish Disability Age 5 to 17
COMPARE
Immigrants from Italy
Scotch-Irish
Disability Age 5 to 17
Disability Age 5 to 17 Comparison
Immigrants from Italy
Scotch-Irish
5.3%
DISABILITY AGE 5 TO 17
98.4/ 100
METRIC RATING
105th/ 347
METRIC RANK
6.3%
DISABILITY AGE 5 TO 17
0.0/ 100
METRIC RATING
308th/ 347
METRIC RANK
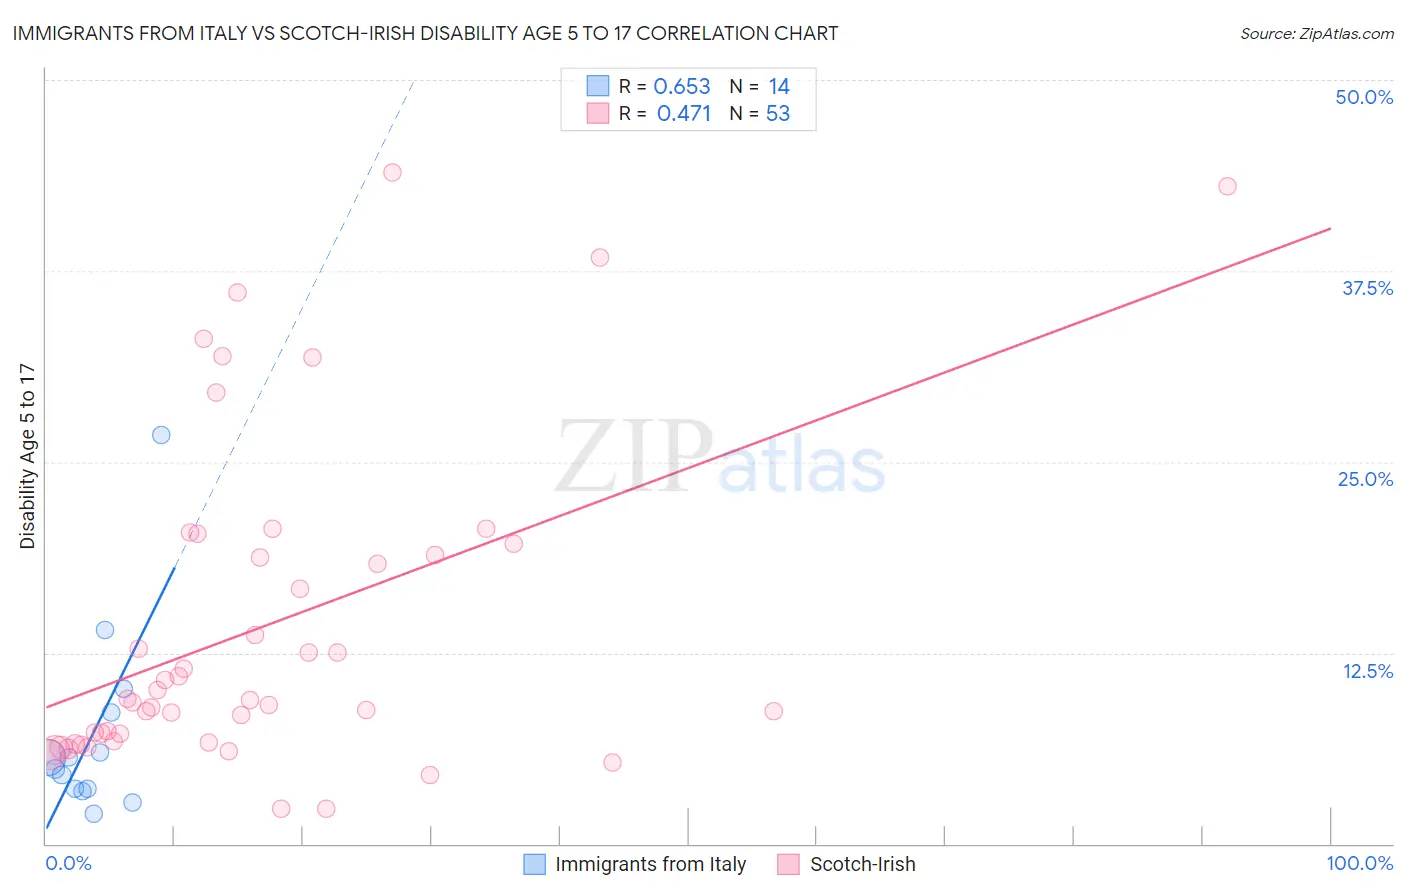
Immigrants from Italy vs Scotch-Irish Disability Age 5 to 17 Correlation Chart
The statistical analysis conducted on geographies consisting of 321,280,380 people shows a significant positive correlation between the proportion of Immigrants from Italy and percentage of population with a disability between the ages 5 and 17 in the United States with a correlation coefficient (R) of 0.653 and weighted average of 5.3%. Similarly, the statistical analysis conducted on geographies consisting of 537,256,381 people shows a moderate positive correlation between the proportion of Scotch-Irish and percentage of population with a disability between the ages 5 and 17 in the United States with a correlation coefficient (R) of 0.471 and weighted average of 6.3%, a difference of 19.2%.
Disability Age 5 to 17 Correlation Summary
| Measurement | Immigrants from Italy | Scotch-Irish |
| Minimum | 2.0% | 2.3% |
| Maximum | 26.8% | 43.9% |
| Range | 24.8% | 41.6% |
| Mean | 7.2% | 14.2% |
| Median | 5.3% | 9.4% |
| Interquartile 25% (IQ1) | 3.6% | 6.7% |
| Interquartile 75% (IQ3) | 8.6% | 19.3% |
| Interquartile Range (IQR) | 5.0% | 12.6% |
| Standard Deviation (Sample) | 6.5% | 10.6% |
| Standard Deviation (Population) | 6.3% | 10.5% |
Similar Demographics by Disability Age 5 to 17
Demographics Similar to Immigrants from Italy by Disability Age 5 to 17
In terms of disability age 5 to 17, the demographic groups most similar to Immigrants from Italy are Peruvian (5.3%, a difference of 0.090%), Immigrants from Yemen (5.3%, a difference of 0.13%), Russian (5.3%, a difference of 0.16%), Salvadoran (5.3%, a difference of 0.17%), and Nicaraguan (5.3%, a difference of 0.19%).
| Demographics | Rating | Rank | Disability Age 5 to 17 |
| Immigrants | Austria | 98.9 /100 | #98 | Exceptional 5.3% |
| Cambodians | 98.8 /100 | #99 | Exceptional 5.3% |
| Nepalese | 98.7 /100 | #100 | Exceptional 5.3% |
| Menominee | 98.7 /100 | #101 | Exceptional 5.3% |
| Nicaraguans | 98.6 /100 | #102 | Exceptional 5.3% |
| Salvadorans | 98.6 /100 | #103 | Exceptional 5.3% |
| Peruvians | 98.5 /100 | #104 | Exceptional 5.3% |
| Immigrants | Italy | 98.4 /100 | #105 | Exceptional 5.3% |
| Immigrants | Yemen | 98.2 /100 | #106 | Exceptional 5.3% |
| Russians | 98.2 /100 | #107 | Exceptional 5.3% |
| Immigrants | South Africa | 98.1 /100 | #108 | Exceptional 5.3% |
| Immigrants | Northern Africa | 98.1 /100 | #109 | Exceptional 5.3% |
| Immigrants | Eritrea | 98.0 /100 | #110 | Exceptional 5.3% |
| Ethiopians | 97.9 /100 | #111 | Exceptional 5.3% |
| Immigrants | Latvia | 97.9 /100 | #112 | Exceptional 5.3% |
Demographics Similar to Scotch-Irish by Disability Age 5 to 17
In terms of disability age 5 to 17, the demographic groups most similar to Scotch-Irish are Hmong (6.3%, a difference of 0.020%), Alaskan Athabascan (6.3%, a difference of 0.16%), Immigrants from Dominica (6.3%, a difference of 0.20%), Bahamian (6.3%, a difference of 0.23%), and Bermudan (6.4%, a difference of 0.32%).
| Demographics | Rating | Rank | Disability Age 5 to 17 |
| U.S. Virgin Islanders | 0.0 /100 | #301 | Tragic 6.3% |
| Celtics | 0.0 /100 | #302 | Tragic 6.3% |
| Yakama | 0.0 /100 | #303 | Tragic 6.3% |
| Senegalese | 0.0 /100 | #304 | Tragic 6.3% |
| Natives/Alaskans | 0.0 /100 | #305 | Tragic 6.3% |
| Immigrants | Nonimmigrants | 0.0 /100 | #306 | Tragic 6.3% |
| Bahamians | 0.0 /100 | #307 | Tragic 6.3% |
| Scotch-Irish | 0.0 /100 | #308 | Tragic 6.3% |
| Hmong | 0.0 /100 | #309 | Tragic 6.3% |
| Alaskan Athabascans | 0.0 /100 | #310 | Tragic 6.3% |
| Immigrants | Dominica | 0.0 /100 | #311 | Tragic 6.3% |
| Bermudans | 0.0 /100 | #312 | Tragic 6.4% |
| Apache | 0.0 /100 | #313 | Tragic 6.4% |
| French | 0.0 /100 | #314 | Tragic 6.4% |
| Immigrants | Portugal | 0.0 /100 | #315 | Tragic 6.4% |