Austrian vs Scotch-Irish Disability Age 5 to 17
COMPARE
Austrian
Scotch-Irish
Disability Age 5 to 17
Disability Age 5 to 17 Comparison
Austrians
Scotch-Irish
5.7%
DISABILITY AGE 5 TO 17
13.2/ 100
METRIC RATING
202nd/ 347
METRIC RANK
6.3%
DISABILITY AGE 5 TO 17
0.0/ 100
METRIC RATING
308th/ 347
METRIC RANK
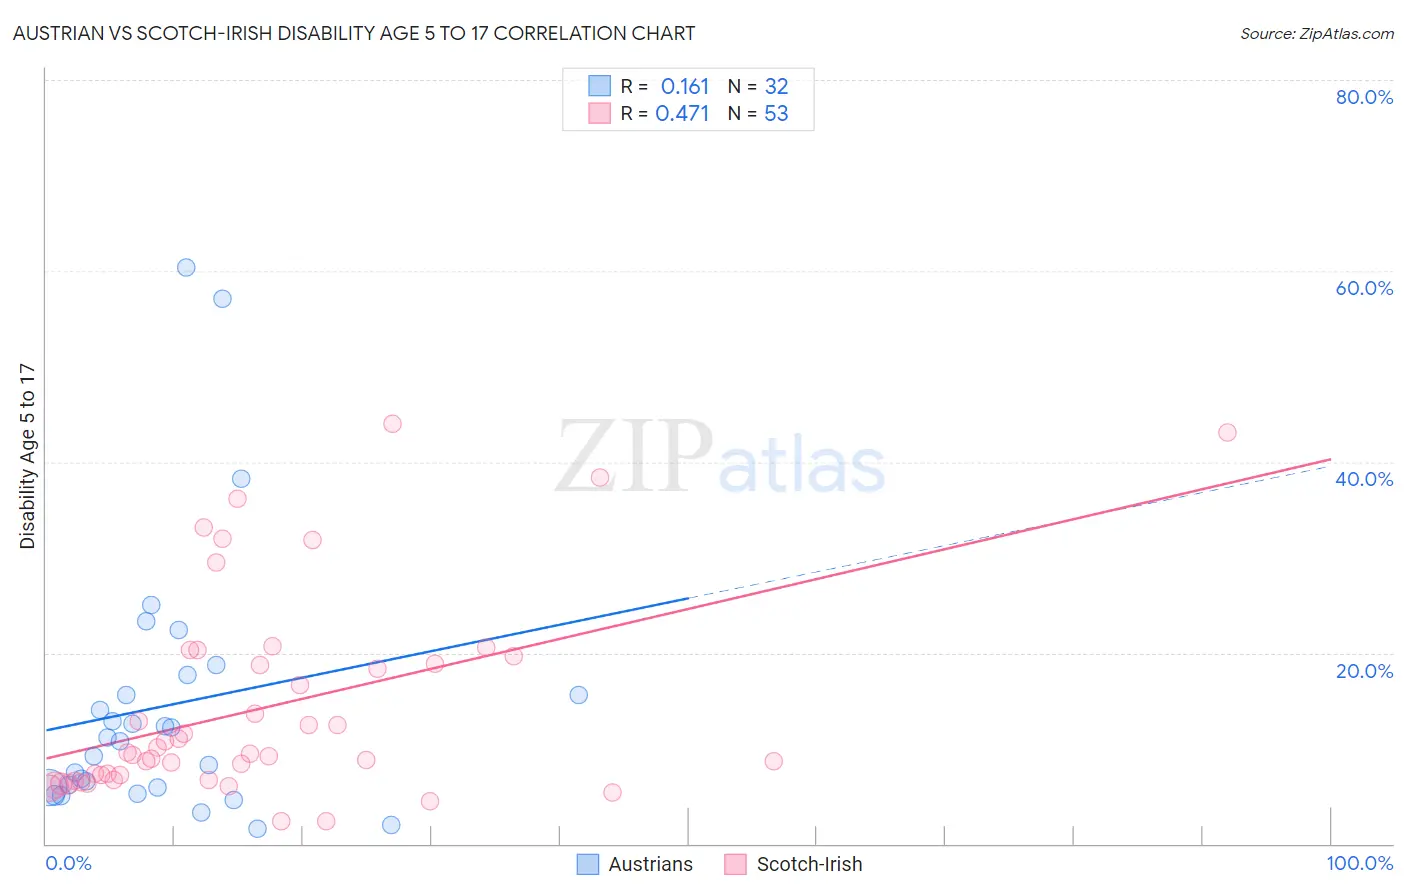
Austrian vs Scotch-Irish Disability Age 5 to 17 Correlation Chart
The statistical analysis conducted on geographies consisting of 446,287,500 people shows a poor positive correlation between the proportion of Austrians and percentage of population with a disability between the ages 5 and 17 in the United States with a correlation coefficient (R) of 0.161 and weighted average of 5.7%. Similarly, the statistical analysis conducted on geographies consisting of 537,256,381 people shows a moderate positive correlation between the proportion of Scotch-Irish and percentage of population with a disability between the ages 5 and 17 in the United States with a correlation coefficient (R) of 0.471 and weighted average of 6.3%, a difference of 10.6%.
Disability Age 5 to 17 Correlation Summary
| Measurement | Austrian | Scotch-Irish |
| Minimum | 1.5% | 2.3% |
| Maximum | 60.4% | 43.9% |
| Range | 58.9% | 41.6% |
| Mean | 14.5% | 14.2% |
| Median | 10.9% | 9.4% |
| Interquartile 25% (IQ1) | 5.9% | 6.7% |
| Interquartile 75% (IQ3) | 16.6% | 19.3% |
| Interquartile Range (IQR) | 10.8% | 12.6% |
| Standard Deviation (Sample) | 14.0% | 10.6% |
| Standard Deviation (Population) | 13.8% | 10.5% |
Similar Demographics by Disability Age 5 to 17
Demographics Similar to Austrians by Disability Age 5 to 17
In terms of disability age 5 to 17, the demographic groups most similar to Austrians are Spanish American Indian (5.7%, a difference of 0.040%), Basque (5.7%, a difference of 0.050%), Icelander (5.7%, a difference of 0.14%), Northern European (5.7%, a difference of 0.20%), and Paiute (5.7%, a difference of 0.22%).
| Demographics | Rating | Rank | Disability Age 5 to 17 |
| Immigrants | Nigeria | 23.4 /100 | #195 | Fair 5.7% |
| Inupiat | 23.3 /100 | #196 | Fair 5.7% |
| Immigrants | North America | 23.1 /100 | #197 | Fair 5.7% |
| Norwegians | 20.9 /100 | #198 | Fair 5.7% |
| Northern Europeans | 15.2 /100 | #199 | Poor 5.7% |
| Icelanders | 14.6 /100 | #200 | Poor 5.7% |
| Basques | 13.7 /100 | #201 | Poor 5.7% |
| Austrians | 13.2 /100 | #202 | Poor 5.7% |
| Spanish American Indians | 12.8 /100 | #203 | Poor 5.7% |
| Paiute | 11.2 /100 | #204 | Poor 5.7% |
| Trinidadians and Tobagonians | 10.8 /100 | #205 | Poor 5.7% |
| Immigrants | Africa | 10.8 /100 | #206 | Poor 5.7% |
| Moroccans | 10.4 /100 | #207 | Poor 5.7% |
| Kenyans | 10.0 /100 | #208 | Poor 5.8% |
| Immigrants | Uganda | 9.7 /100 | #209 | Tragic 5.8% |
Demographics Similar to Scotch-Irish by Disability Age 5 to 17
In terms of disability age 5 to 17, the demographic groups most similar to Scotch-Irish are Hmong (6.3%, a difference of 0.020%), Alaskan Athabascan (6.3%, a difference of 0.16%), Immigrants from Dominica (6.3%, a difference of 0.20%), Bahamian (6.3%, a difference of 0.23%), and Bermudan (6.4%, a difference of 0.32%).
| Demographics | Rating | Rank | Disability Age 5 to 17 |
| U.S. Virgin Islanders | 0.0 /100 | #301 | Tragic 6.3% |
| Celtics | 0.0 /100 | #302 | Tragic 6.3% |
| Yakama | 0.0 /100 | #303 | Tragic 6.3% |
| Senegalese | 0.0 /100 | #304 | Tragic 6.3% |
| Natives/Alaskans | 0.0 /100 | #305 | Tragic 6.3% |
| Immigrants | Nonimmigrants | 0.0 /100 | #306 | Tragic 6.3% |
| Bahamians | 0.0 /100 | #307 | Tragic 6.3% |
| Scotch-Irish | 0.0 /100 | #308 | Tragic 6.3% |
| Hmong | 0.0 /100 | #309 | Tragic 6.3% |
| Alaskan Athabascans | 0.0 /100 | #310 | Tragic 6.3% |
| Immigrants | Dominica | 0.0 /100 | #311 | Tragic 6.3% |
| Bermudans | 0.0 /100 | #312 | Tragic 6.4% |
| Apache | 0.0 /100 | #313 | Tragic 6.4% |
| French | 0.0 /100 | #314 | Tragic 6.4% |
| Immigrants | Portugal | 0.0 /100 | #315 | Tragic 6.4% |