Immigrants from Thailand vs Cree Self-Care Disability
COMPARE
Immigrants from Thailand
Cree
Self-Care Disability
Self-Care Disability Comparison
Immigrants from Thailand
Cree
2.6%
SELF-CARE DISABILITY
4.5/ 100
METRIC RATING
215th/ 347
METRIC RANK
2.8%
SELF-CARE DISABILITY
0.0/ 100
METRIC RATING
304th/ 347
METRIC RANK
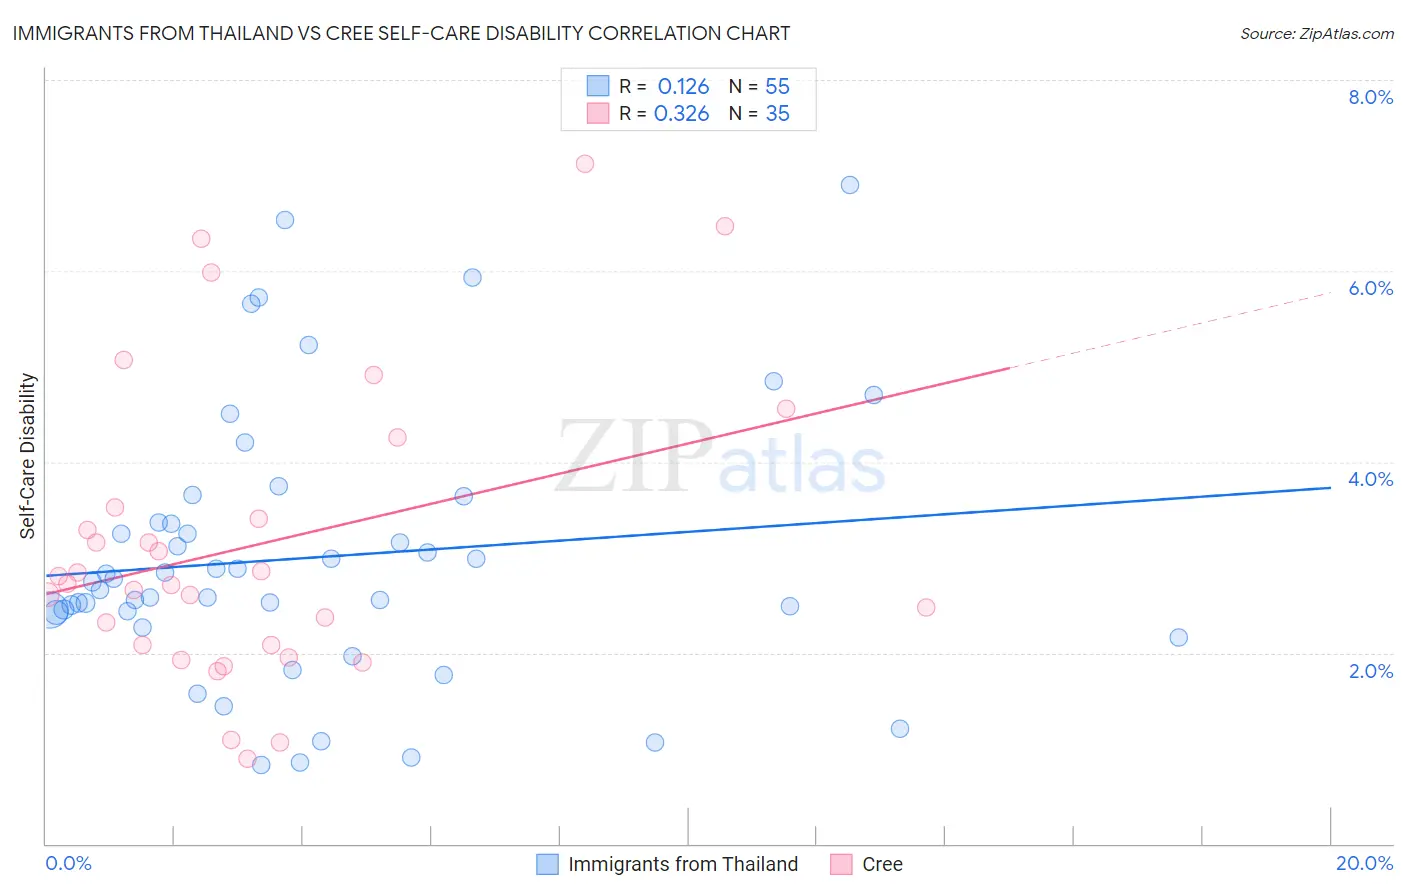
Immigrants from Thailand vs Cree Self-Care Disability Correlation Chart
The statistical analysis conducted on geographies consisting of 316,791,227 people shows a poor positive correlation between the proportion of Immigrants from Thailand and percentage of population with self-care disability in the United States with a correlation coefficient (R) of 0.126 and weighted average of 2.6%. Similarly, the statistical analysis conducted on geographies consisting of 76,186,163 people shows a mild positive correlation between the proportion of Cree and percentage of population with self-care disability in the United States with a correlation coefficient (R) of 0.326 and weighted average of 2.8%, a difference of 9.2%.
Self-Care Disability Correlation Summary
| Measurement | Immigrants from Thailand | Cree |
| Minimum | 0.83% | 0.89% |
| Maximum | 6.9% | 7.1% |
| Range | 6.1% | 6.2% |
| Mean | 3.0% | 3.1% |
| Median | 2.7% | 2.7% |
| Interquartile 25% (IQ1) | 2.4% | 2.1% |
| Interquartile 75% (IQ3) | 3.4% | 3.5% |
| Interquartile Range (IQR) | 0.94% | 1.4% |
| Standard Deviation (Sample) | 1.4% | 1.6% |
| Standard Deviation (Population) | 1.4% | 1.5% |
Similar Demographics by Self-Care Disability
Demographics Similar to Immigrants from Thailand by Self-Care Disability
In terms of self-care disability, the demographic groups most similar to Immigrants from Thailand are White/Caucasian (2.6%, a difference of 0.020%), Immigrants from Honduras (2.6%, a difference of 0.040%), Celtic (2.6%, a difference of 0.040%), Ecuadorian (2.6%, a difference of 0.050%), and Scotch-Irish (2.6%, a difference of 0.11%).
| Demographics | Rating | Rank | Self-Care Disability |
| Central Americans | 8.7 /100 | #208 | Tragic 2.5% |
| Malaysians | 7.7 /100 | #209 | Tragic 2.5% |
| Panamanians | 6.4 /100 | #210 | Tragic 2.5% |
| Native Hawaiians | 5.1 /100 | #211 | Tragic 2.6% |
| Samoans | 5.1 /100 | #212 | Tragic 2.6% |
| Ecuadorians | 4.7 /100 | #213 | Tragic 2.6% |
| Immigrants | Honduras | 4.7 /100 | #214 | Tragic 2.6% |
| Immigrants | Thailand | 4.5 /100 | #215 | Tragic 2.6% |
| Whites/Caucasians | 4.4 /100 | #216 | Tragic 2.6% |
| Celtics | 4.4 /100 | #217 | Tragic 2.6% |
| Scotch-Irish | 4.1 /100 | #218 | Tragic 2.6% |
| Immigrants | Moldova | 4.0 /100 | #219 | Tragic 2.6% |
| Sub-Saharan Africans | 4.0 /100 | #220 | Tragic 2.6% |
| Hondurans | 3.8 /100 | #221 | Tragic 2.6% |
| Spaniards | 3.8 /100 | #222 | Tragic 2.6% |
Demographics Similar to Cree by Self-Care Disability
In terms of self-care disability, the demographic groups most similar to Cree are Immigrants from West Indies (2.8%, a difference of 0.050%), Immigrants from Belize (2.8%, a difference of 0.16%), Immigrants from St. Vincent and the Grenadines (2.8%, a difference of 0.30%), Pima (2.8%, a difference of 0.34%), and Immigrants from Fiji (2.8%, a difference of 0.43%).
| Demographics | Rating | Rank | Self-Care Disability |
| West Indians | 0.0 /100 | #297 | Tragic 2.8% |
| Americans | 0.0 /100 | #298 | Tragic 2.8% |
| Immigrants | Guyana | 0.0 /100 | #299 | Tragic 2.8% |
| Immigrants | Fiji | 0.0 /100 | #300 | Tragic 2.8% |
| Pima | 0.0 /100 | #301 | Tragic 2.8% |
| Immigrants | St. Vincent and the Grenadines | 0.0 /100 | #302 | Tragic 2.8% |
| Immigrants | Belize | 0.0 /100 | #303 | Tragic 2.8% |
| Cree | 0.0 /100 | #304 | Tragic 2.8% |
| Immigrants | West Indies | 0.0 /100 | #305 | Tragic 2.8% |
| Aleuts | 0.0 /100 | #306 | Tragic 2.8% |
| Natives/Alaskans | 0.0 /100 | #307 | Tragic 2.8% |
| Immigrants | Grenada | 0.0 /100 | #308 | Tragic 2.8% |
| Bangladeshis | 0.0 /100 | #309 | Tragic 2.8% |
| British West Indians | 0.0 /100 | #310 | Tragic 2.8% |
| Puget Sound Salish | 0.0 /100 | #311 | Tragic 2.8% |