Indonesian vs Cree Self-Care Disability
COMPARE
Indonesian
Cree
Self-Care Disability
Self-Care Disability Comparison
Indonesians
Cree
2.5%
SELF-CARE DISABILITY
41.2/ 100
METRIC RATING
180th/ 347
METRIC RANK
2.8%
SELF-CARE DISABILITY
0.0/ 100
METRIC RATING
304th/ 347
METRIC RANK
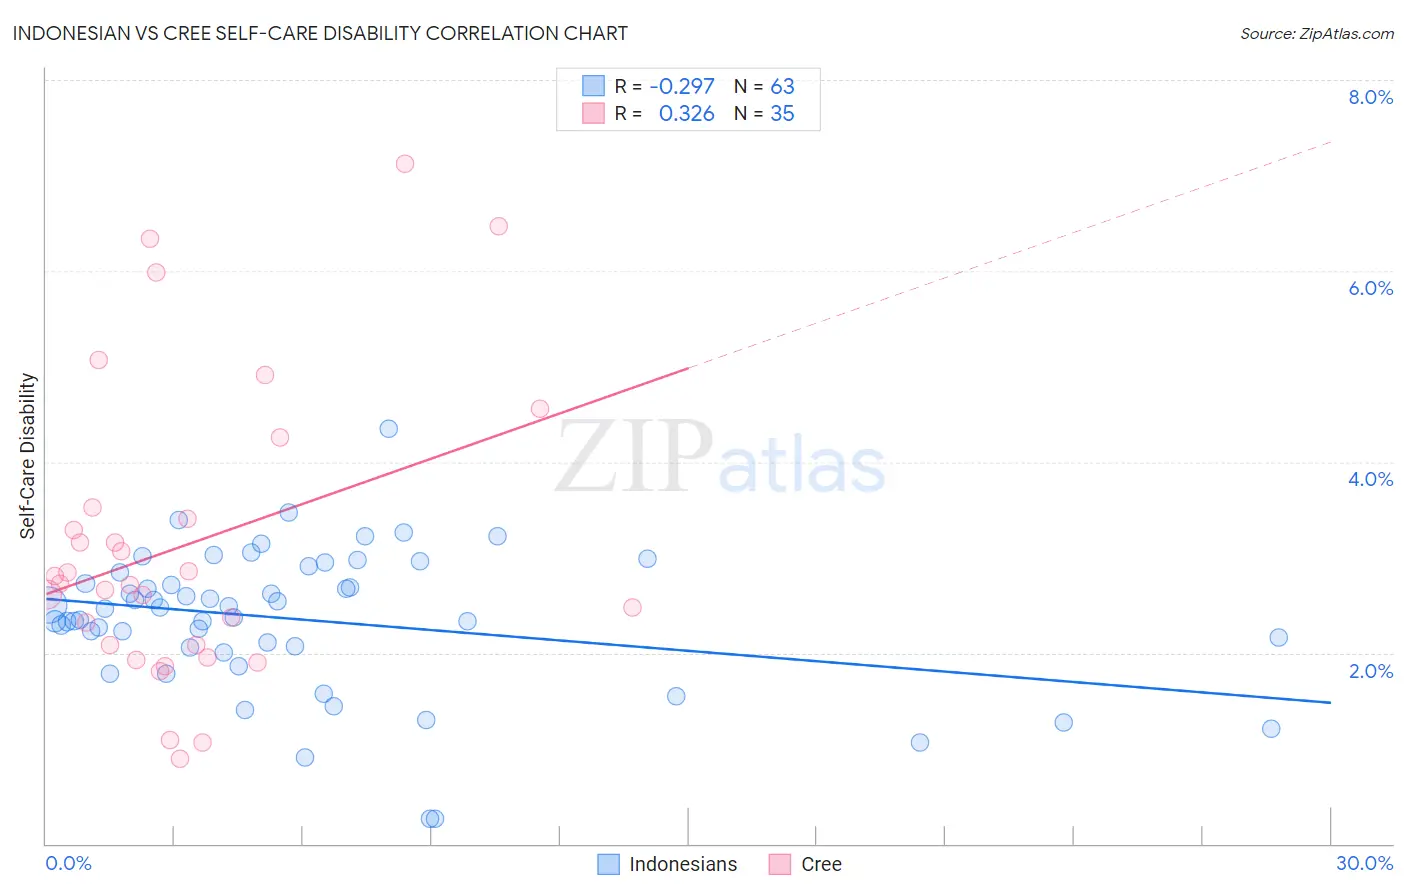
Indonesian vs Cree Self-Care Disability Correlation Chart
The statistical analysis conducted on geographies consisting of 162,620,981 people shows a weak negative correlation between the proportion of Indonesians and percentage of population with self-care disability in the United States with a correlation coefficient (R) of -0.297 and weighted average of 2.5%. Similarly, the statistical analysis conducted on geographies consisting of 76,186,163 people shows a mild positive correlation between the proportion of Cree and percentage of population with self-care disability in the United States with a correlation coefficient (R) of 0.326 and weighted average of 2.8%, a difference of 12.7%.
Self-Care Disability Correlation Summary
| Measurement | Indonesian | Cree |
| Minimum | 0.26% | 0.89% |
| Maximum | 4.4% | 7.1% |
| Range | 4.1% | 6.2% |
| Mean | 2.3% | 3.1% |
| Median | 2.5% | 2.7% |
| Interquartile 25% (IQ1) | 2.1% | 2.1% |
| Interquartile 75% (IQ3) | 2.8% | 3.5% |
| Interquartile Range (IQR) | 0.79% | 1.4% |
| Standard Deviation (Sample) | 0.74% | 1.6% |
| Standard Deviation (Population) | 0.74% | 1.5% |
Similar Demographics by Self-Care Disability
Demographics Similar to Indonesians by Self-Care Disability
In terms of self-care disability, the demographic groups most similar to Indonesians are Ghanaian (2.5%, a difference of 0.040%), Maltese (2.5%, a difference of 0.19%), Hungarian (2.5%, a difference of 0.21%), English (2.5%, a difference of 0.24%), and Salvadoran (2.5%, a difference of 0.24%).
| Demographics | Rating | Rank | Self-Care Disability |
| Immigrants | Burma/Myanmar | 52.8 /100 | #173 | Average 2.5% |
| Welsh | 50.0 /100 | #174 | Average 2.5% |
| Immigrants | Bosnia and Herzegovina | 49.6 /100 | #175 | Average 2.5% |
| Immigrants | Afghanistan | 47.6 /100 | #176 | Average 2.5% |
| Immigrants | Kazakhstan | 46.7 /100 | #177 | Average 2.5% |
| English | 46.2 /100 | #178 | Average 2.5% |
| Hungarians | 45.5 /100 | #179 | Average 2.5% |
| Indonesians | 41.2 /100 | #180 | Average 2.5% |
| Ghanaians | 40.4 /100 | #181 | Average 2.5% |
| Maltese | 37.5 /100 | #182 | Fair 2.5% |
| Salvadorans | 36.4 /100 | #183 | Fair 2.5% |
| Yugoslavians | 36.1 /100 | #184 | Fair 2.5% |
| Slavs | 34.3 /100 | #185 | Fair 2.5% |
| Immigrants | El Salvador | 33.0 /100 | #186 | Fair 2.5% |
| Irish | 28.7 /100 | #187 | Fair 2.5% |
Demographics Similar to Cree by Self-Care Disability
In terms of self-care disability, the demographic groups most similar to Cree are Immigrants from West Indies (2.8%, a difference of 0.050%), Immigrants from Belize (2.8%, a difference of 0.16%), Immigrants from St. Vincent and the Grenadines (2.8%, a difference of 0.30%), Pima (2.8%, a difference of 0.34%), and Immigrants from Fiji (2.8%, a difference of 0.43%).
| Demographics | Rating | Rank | Self-Care Disability |
| West Indians | 0.0 /100 | #297 | Tragic 2.8% |
| Americans | 0.0 /100 | #298 | Tragic 2.8% |
| Immigrants | Guyana | 0.0 /100 | #299 | Tragic 2.8% |
| Immigrants | Fiji | 0.0 /100 | #300 | Tragic 2.8% |
| Pima | 0.0 /100 | #301 | Tragic 2.8% |
| Immigrants | St. Vincent and the Grenadines | 0.0 /100 | #302 | Tragic 2.8% |
| Immigrants | Belize | 0.0 /100 | #303 | Tragic 2.8% |
| Cree | 0.0 /100 | #304 | Tragic 2.8% |
| Immigrants | West Indies | 0.0 /100 | #305 | Tragic 2.8% |
| Aleuts | 0.0 /100 | #306 | Tragic 2.8% |
| Natives/Alaskans | 0.0 /100 | #307 | Tragic 2.8% |
| Immigrants | Grenada | 0.0 /100 | #308 | Tragic 2.8% |
| Bangladeshis | 0.0 /100 | #309 | Tragic 2.8% |
| British West Indians | 0.0 /100 | #310 | Tragic 2.8% |
| Puget Sound Salish | 0.0 /100 | #311 | Tragic 2.8% |