Immigrants from Belarus vs Cree Self-Care Disability
COMPARE
Immigrants from Belarus
Cree
Self-Care Disability
Self-Care Disability Comparison
Immigrants from Belarus
Cree
2.6%
SELF-CARE DISABILITY
0.2/ 100
METRIC RATING
259th/ 347
METRIC RANK
2.8%
SELF-CARE DISABILITY
0.0/ 100
METRIC RATING
304th/ 347
METRIC RANK
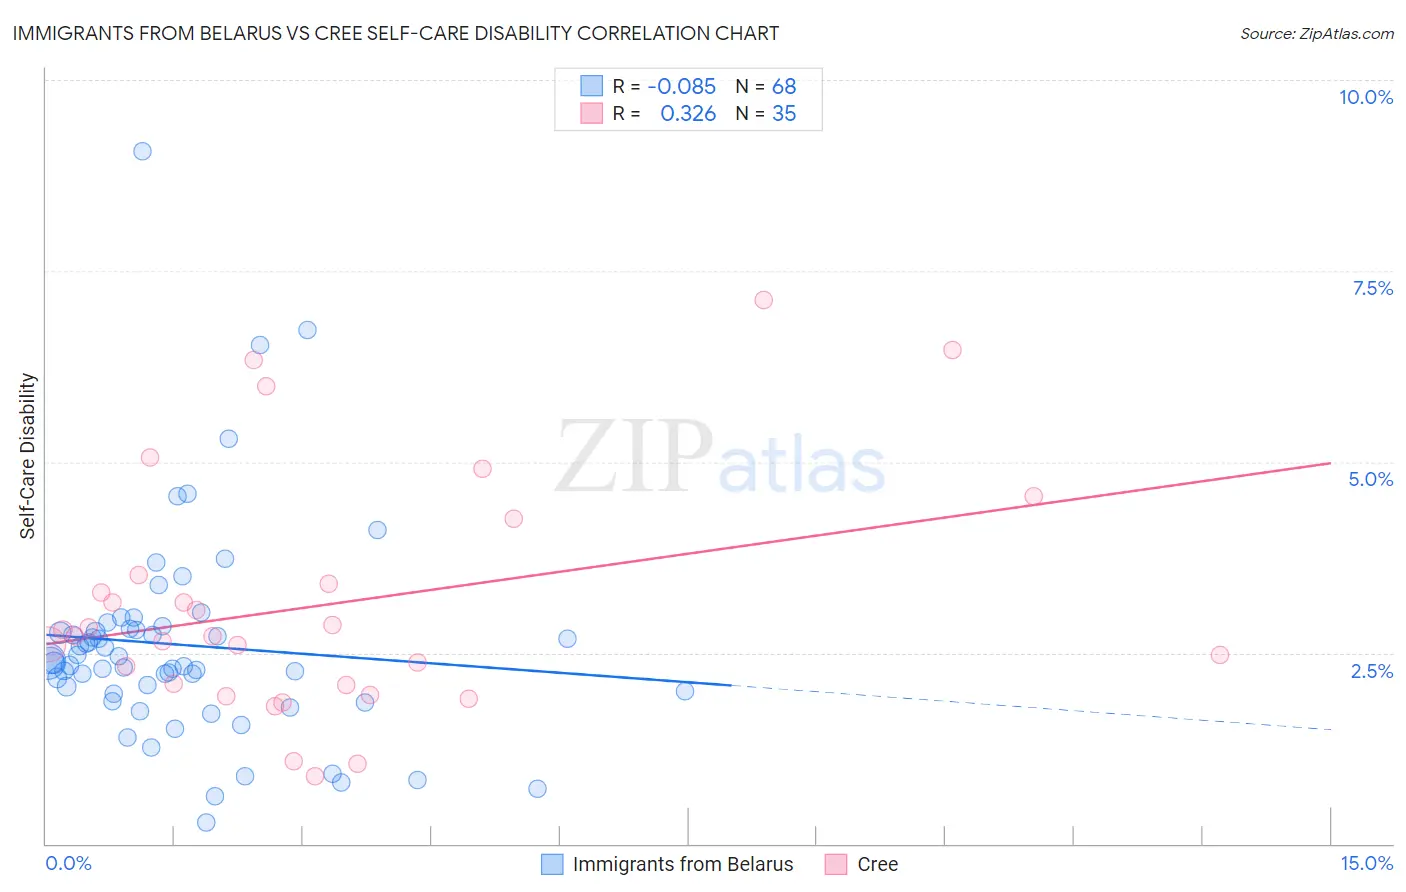
Immigrants from Belarus vs Cree Self-Care Disability Correlation Chart
The statistical analysis conducted on geographies consisting of 150,167,349 people shows a slight negative correlation between the proportion of Immigrants from Belarus and percentage of population with self-care disability in the United States with a correlation coefficient (R) of -0.085 and weighted average of 2.6%. Similarly, the statistical analysis conducted on geographies consisting of 76,186,163 people shows a mild positive correlation between the proportion of Cree and percentage of population with self-care disability in the United States with a correlation coefficient (R) of 0.326 and weighted average of 2.8%, a difference of 5.6%.
Self-Care Disability Correlation Summary
| Measurement | Immigrants from Belarus | Cree |
| Minimum | 0.28% | 0.89% |
| Maximum | 9.1% | 7.1% |
| Range | 8.8% | 6.2% |
| Mean | 2.6% | 3.1% |
| Median | 2.4% | 2.7% |
| Interquartile 25% (IQ1) | 2.0% | 2.1% |
| Interquartile 75% (IQ3) | 2.8% | 3.5% |
| Interquartile Range (IQR) | 0.83% | 1.4% |
| Standard Deviation (Sample) | 1.4% | 1.6% |
| Standard Deviation (Population) | 1.4% | 1.5% |
Similar Demographics by Self-Care Disability
Demographics Similar to Immigrants from Belarus by Self-Care Disability
In terms of self-care disability, the demographic groups most similar to Immigrants from Belarus are Chippewa (2.6%, a difference of 0.040%), Arapaho (2.6%, a difference of 0.060%), Nonimmigrants (2.6%, a difference of 0.070%), Potawatomi (2.6%, a difference of 0.14%), and Shoshone (2.7%, a difference of 0.20%).
| Demographics | Rating | Rank | Self-Care Disability |
| Immigrants | Bangladesh | 0.4 /100 | #252 | Tragic 2.6% |
| Immigrants | Haiti | 0.3 /100 | #253 | Tragic 2.6% |
| Haitians | 0.3 /100 | #254 | Tragic 2.6% |
| Tsimshian | 0.3 /100 | #255 | Tragic 2.6% |
| Immigrants | Central America | 0.3 /100 | #256 | Tragic 2.6% |
| Potawatomi | 0.3 /100 | #257 | Tragic 2.6% |
| Immigrants | Nonimmigrants | 0.3 /100 | #258 | Tragic 2.6% |
| Immigrants | Belarus | 0.2 /100 | #259 | Tragic 2.6% |
| Chippewa | 0.2 /100 | #260 | Tragic 2.6% |
| Arapaho | 0.2 /100 | #261 | Tragic 2.6% |
| Shoshone | 0.2 /100 | #262 | Tragic 2.7% |
| Immigrants | Latin America | 0.2 /100 | #263 | Tragic 2.7% |
| Immigrants | Iran | 0.2 /100 | #264 | Tragic 2.7% |
| Immigrants | Nicaragua | 0.2 /100 | #265 | Tragic 2.7% |
| Immigrants | Cambodia | 0.1 /100 | #266 | Tragic 2.7% |
Demographics Similar to Cree by Self-Care Disability
In terms of self-care disability, the demographic groups most similar to Cree are Immigrants from West Indies (2.8%, a difference of 0.050%), Immigrants from Belize (2.8%, a difference of 0.16%), Immigrants from St. Vincent and the Grenadines (2.8%, a difference of 0.30%), Pima (2.8%, a difference of 0.34%), and Immigrants from Fiji (2.8%, a difference of 0.43%).
| Demographics | Rating | Rank | Self-Care Disability |
| West Indians | 0.0 /100 | #297 | Tragic 2.8% |
| Americans | 0.0 /100 | #298 | Tragic 2.8% |
| Immigrants | Guyana | 0.0 /100 | #299 | Tragic 2.8% |
| Immigrants | Fiji | 0.0 /100 | #300 | Tragic 2.8% |
| Pima | 0.0 /100 | #301 | Tragic 2.8% |
| Immigrants | St. Vincent and the Grenadines | 0.0 /100 | #302 | Tragic 2.8% |
| Immigrants | Belize | 0.0 /100 | #303 | Tragic 2.8% |
| Cree | 0.0 /100 | #304 | Tragic 2.8% |
| Immigrants | West Indies | 0.0 /100 | #305 | Tragic 2.8% |
| Aleuts | 0.0 /100 | #306 | Tragic 2.8% |
| Natives/Alaskans | 0.0 /100 | #307 | Tragic 2.8% |
| Immigrants | Grenada | 0.0 /100 | #308 | Tragic 2.8% |
| Bangladeshis | 0.0 /100 | #309 | Tragic 2.8% |
| British West Indians | 0.0 /100 | #310 | Tragic 2.8% |
| Puget Sound Salish | 0.0 /100 | #311 | Tragic 2.8% |