Immigrants from Thailand vs Cree Disability
COMPARE
Immigrants from Thailand
Cree
Disability
Disability Comparison
Immigrants from Thailand
Cree
12.0%
DISABILITY
9.3/ 100
METRIC RATING
207th/ 347
METRIC RANK
13.7%
DISABILITY
0.0/ 100
METRIC RATING
313th/ 347
METRIC RANK
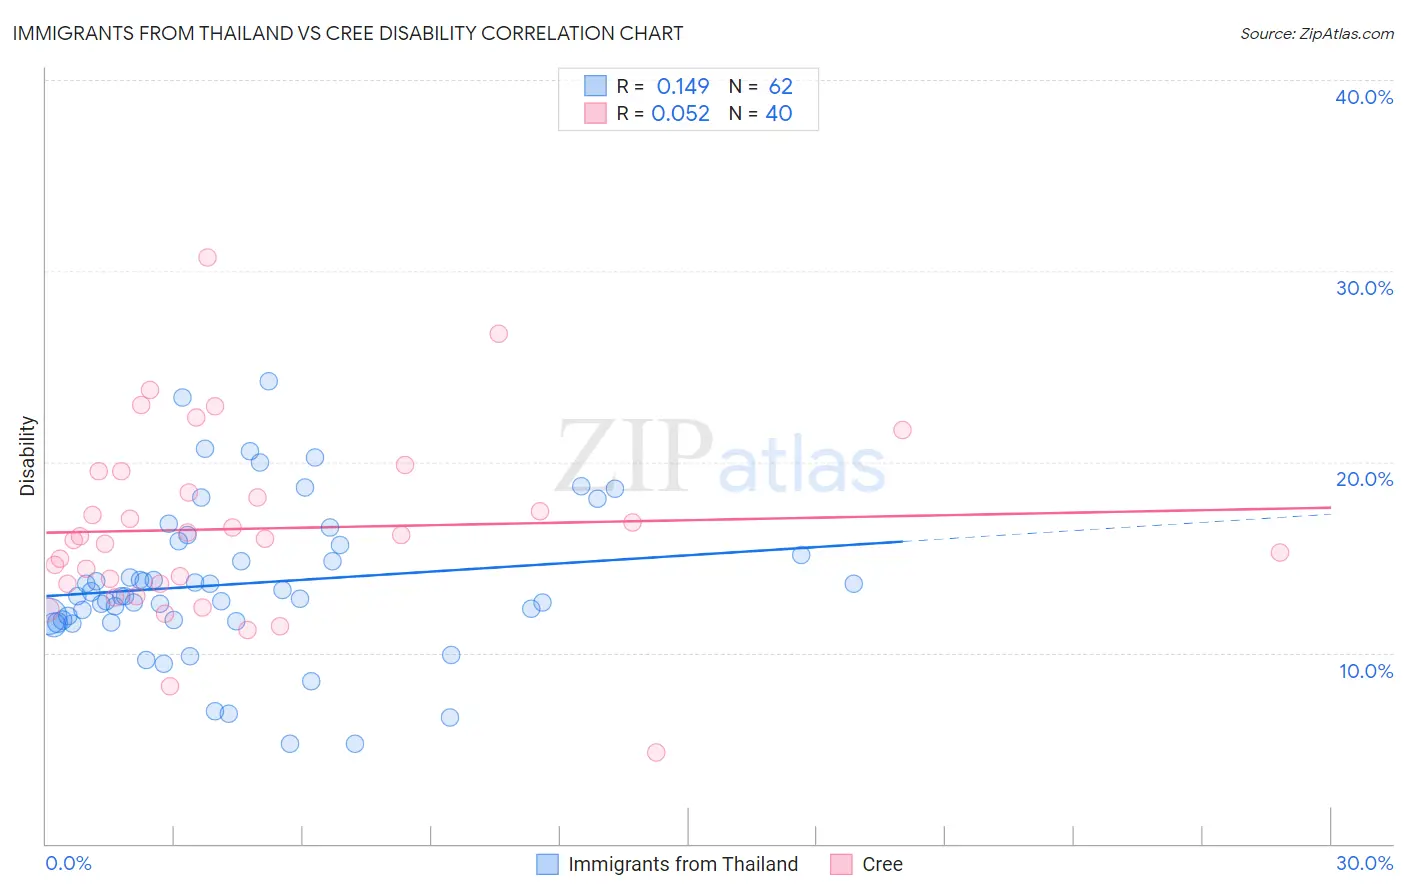
Immigrants from Thailand vs Cree Disability Correlation Chart
The statistical analysis conducted on geographies consisting of 316,986,616 people shows a poor positive correlation between the proportion of Immigrants from Thailand and percentage of population with a disability in the United States with a correlation coefficient (R) of 0.149 and weighted average of 12.0%. Similarly, the statistical analysis conducted on geographies consisting of 76,208,800 people shows a slight positive correlation between the proportion of Cree and percentage of population with a disability in the United States with a correlation coefficient (R) of 0.052 and weighted average of 13.7%, a difference of 14.2%.
Disability Correlation Summary
| Measurement | Immigrants from Thailand | Cree |
| Minimum | 5.2% | 4.8% |
| Maximum | 24.2% | 30.7% |
| Range | 19.0% | 25.9% |
| Mean | 13.6% | 16.5% |
| Median | 13.0% | 16.1% |
| Interquartile 25% (IQ1) | 11.7% | 13.6% |
| Interquartile 75% (IQ3) | 15.6% | 18.9% |
| Interquartile Range (IQR) | 4.0% | 5.3% |
| Standard Deviation (Sample) | 4.0% | 4.9% |
| Standard Deviation (Population) | 3.9% | 4.8% |
Similar Demographics by Disability
Demographics Similar to Immigrants from Thailand by Disability
In terms of disability, the demographic groups most similar to Immigrants from Thailand are Immigrants from Senegal (12.0%, a difference of 0.010%), Immigrants from Caribbean (12.0%, a difference of 0.020%), Danish (12.0%, a difference of 0.070%), Immigrants from Western Europe (12.0%, a difference of 0.10%), and Czech (12.0%, a difference of 0.19%).
| Demographics | Rating | Rank | Disability |
| Belizeans | 12.8 /100 | #200 | Poor 11.9% |
| Assyrians/Chaldeans/Syriacs | 12.6 /100 | #201 | Poor 11.9% |
| Immigrants | England | 12.0 /100 | #202 | Poor 12.0% |
| British West Indians | 11.5 /100 | #203 | Poor 12.0% |
| Mexican American Indians | 11.4 /100 | #204 | Poor 12.0% |
| Immigrants | Western Europe | 10.1 /100 | #205 | Poor 12.0% |
| Immigrants | Senegal | 9.4 /100 | #206 | Tragic 12.0% |
| Immigrants | Thailand | 9.3 /100 | #207 | Tragic 12.0% |
| Immigrants | Caribbean | 9.1 /100 | #208 | Tragic 12.0% |
| Danes | 8.7 /100 | #209 | Tragic 12.0% |
| Czechs | 7.9 /100 | #210 | Tragic 12.0% |
| Immigrants | Cambodia | 7.3 /100 | #211 | Tragic 12.0% |
| Austrians | 7.2 /100 | #212 | Tragic 12.0% |
| Immigrants | Iraq | 7.1 /100 | #213 | Tragic 12.0% |
| Immigrants | Somalia | 6.8 /100 | #214 | Tragic 12.0% |
Demographics Similar to Cree by Disability
In terms of disability, the demographic groups most similar to Cree are Black/African American (13.7%, a difference of 0.040%), Puget Sound Salish (13.7%, a difference of 0.040%), Pima (13.7%, a difference of 0.070%), Immigrants from Cabo Verde (13.7%, a difference of 0.070%), and Spanish American (13.6%, a difference of 0.35%).
| Demographics | Rating | Rank | Disability |
| Cape Verdeans | 0.0 /100 | #306 | Tragic 13.5% |
| Shoshone | 0.0 /100 | #307 | Tragic 13.5% |
| French American Indians | 0.0 /100 | #308 | Tragic 13.5% |
| Tlingit-Haida | 0.0 /100 | #309 | Tragic 13.5% |
| Blackfeet | 0.0 /100 | #310 | Tragic 13.6% |
| Delaware | 0.0 /100 | #311 | Tragic 13.6% |
| Spanish Americans | 0.0 /100 | #312 | Tragic 13.6% |
| Cree | 0.0 /100 | #313 | Tragic 13.7% |
| Blacks/African Americans | 0.0 /100 | #314 | Tragic 13.7% |
| Puget Sound Salish | 0.0 /100 | #315 | Tragic 13.7% |
| Pima | 0.0 /100 | #316 | Tragic 13.7% |
| Immigrants | Cabo Verde | 0.0 /100 | #317 | Tragic 13.7% |
| Menominee | 0.0 /100 | #318 | Tragic 13.8% |
| Iroquois | 0.0 /100 | #319 | Tragic 13.8% |
| Apache | 0.0 /100 | #320 | Tragic 13.9% |