Immigrants from Thailand vs Sioux Self-Care Disability
COMPARE
Immigrants from Thailand
Sioux
Self-Care Disability
Self-Care Disability Comparison
Immigrants from Thailand
Sioux
2.6%
SELF-CARE DISABILITY
4.5/ 100
METRIC RATING
215th/ 347
METRIC RANK
2.5%
SELF-CARE DISABILITY
24.6/ 100
METRIC RATING
190th/ 347
METRIC RANK
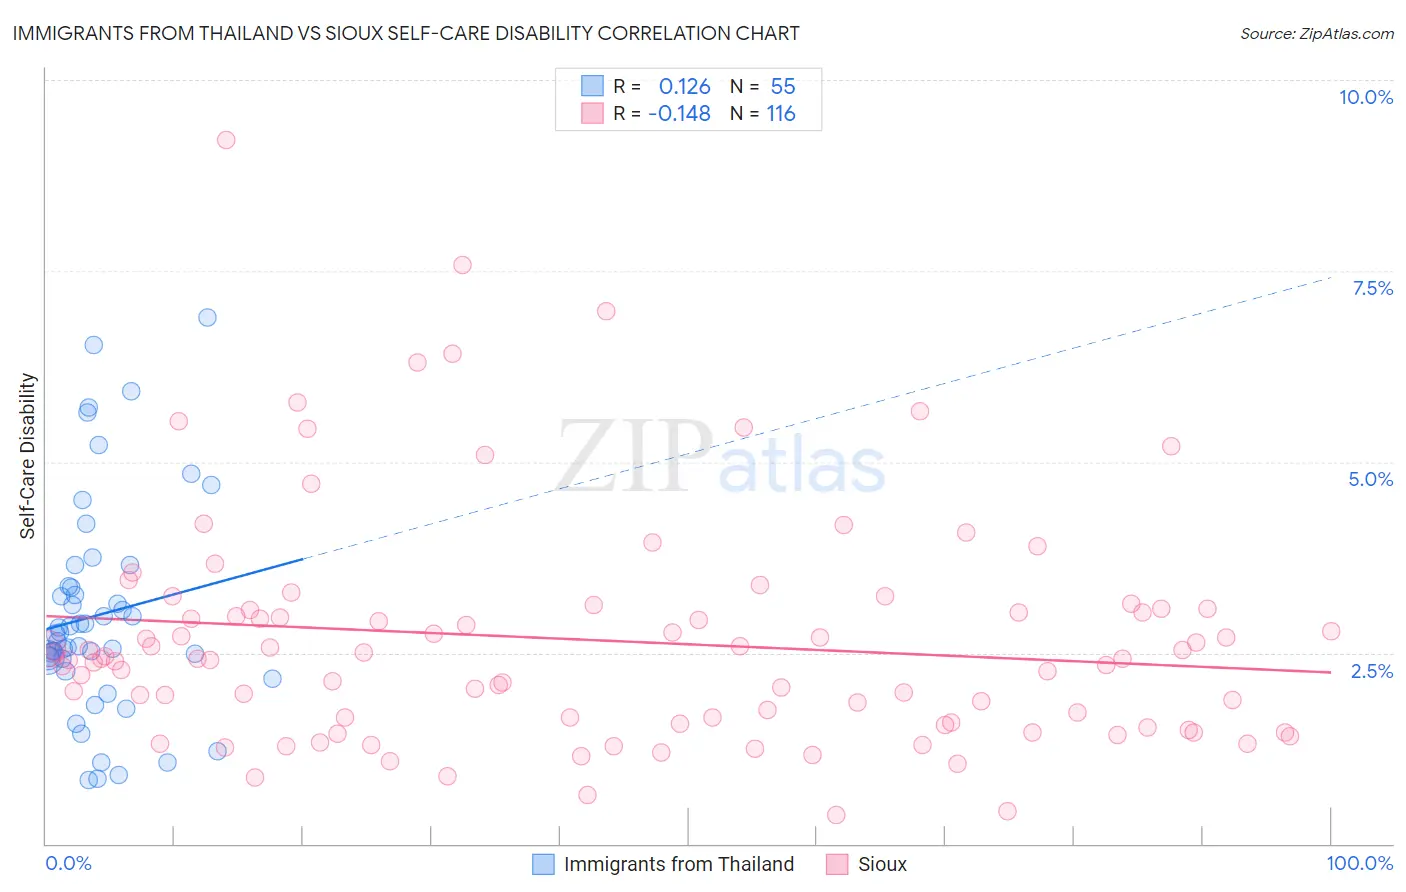
Immigrants from Thailand vs Sioux Self-Care Disability Correlation Chart
The statistical analysis conducted on geographies consisting of 316,791,227 people shows a poor positive correlation between the proportion of Immigrants from Thailand and percentage of population with self-care disability in the United States with a correlation coefficient (R) of 0.126 and weighted average of 2.6%. Similarly, the statistical analysis conducted on geographies consisting of 233,917,854 people shows a poor negative correlation between the proportion of Sioux and percentage of population with self-care disability in the United States with a correlation coefficient (R) of -0.148 and weighted average of 2.5%, a difference of 2.3%.
Self-Care Disability Correlation Summary
| Measurement | Immigrants from Thailand | Sioux |
| Minimum | 0.83% | 0.38% |
| Maximum | 6.9% | 9.2% |
| Range | 6.1% | 8.8% |
| Mean | 3.0% | 2.7% |
| Median | 2.7% | 2.4% |
| Interquartile 25% (IQ1) | 2.4% | 1.6% |
| Interquartile 75% (IQ3) | 3.4% | 3.1% |
| Interquartile Range (IQR) | 0.94% | 1.5% |
| Standard Deviation (Sample) | 1.4% | 1.5% |
| Standard Deviation (Population) | 1.4% | 1.5% |
Similar Demographics by Self-Care Disability
Demographics Similar to Immigrants from Thailand by Self-Care Disability
In terms of self-care disability, the demographic groups most similar to Immigrants from Thailand are White/Caucasian (2.6%, a difference of 0.020%), Immigrants from Honduras (2.6%, a difference of 0.040%), Celtic (2.6%, a difference of 0.040%), Ecuadorian (2.6%, a difference of 0.050%), and Scotch-Irish (2.6%, a difference of 0.11%).
| Demographics | Rating | Rank | Self-Care Disability |
| Central Americans | 8.7 /100 | #208 | Tragic 2.5% |
| Malaysians | 7.7 /100 | #209 | Tragic 2.5% |
| Panamanians | 6.4 /100 | #210 | Tragic 2.5% |
| Native Hawaiians | 5.1 /100 | #211 | Tragic 2.6% |
| Samoans | 5.1 /100 | #212 | Tragic 2.6% |
| Ecuadorians | 4.7 /100 | #213 | Tragic 2.6% |
| Immigrants | Honduras | 4.7 /100 | #214 | Tragic 2.6% |
| Immigrants | Thailand | 4.5 /100 | #215 | Tragic 2.6% |
| Whites/Caucasians | 4.4 /100 | #216 | Tragic 2.6% |
| Celtics | 4.4 /100 | #217 | Tragic 2.6% |
| Scotch-Irish | 4.1 /100 | #218 | Tragic 2.6% |
| Immigrants | Moldova | 4.0 /100 | #219 | Tragic 2.6% |
| Sub-Saharan Africans | 4.0 /100 | #220 | Tragic 2.6% |
| Hondurans | 3.8 /100 | #221 | Tragic 2.6% |
| Spaniards | 3.8 /100 | #222 | Tragic 2.6% |
Demographics Similar to Sioux by Self-Care Disability
In terms of self-care disability, the demographic groups most similar to Sioux are Moroccan (2.5%, a difference of 0.11%), Soviet Union (2.5%, a difference of 0.16%), Immigrants from Eastern Europe (2.5%, a difference of 0.21%), Immigrants from Oceania (2.5%, a difference of 0.22%), and Ukrainian (2.5%, a difference of 0.22%).
| Demographics | Rating | Rank | Self-Care Disability |
| Salvadorans | 36.4 /100 | #183 | Fair 2.5% |
| Yugoslavians | 36.1 /100 | #184 | Fair 2.5% |
| Slavs | 34.3 /100 | #185 | Fair 2.5% |
| Immigrants | El Salvador | 33.0 /100 | #186 | Fair 2.5% |
| Irish | 28.7 /100 | #187 | Fair 2.5% |
| Immigrants | Oceania | 28.3 /100 | #188 | Fair 2.5% |
| Immigrants | Eastern Europe | 28.0 /100 | #189 | Fair 2.5% |
| Sioux | 24.6 /100 | #190 | Fair 2.5% |
| Moroccans | 22.9 /100 | #191 | Fair 2.5% |
| Soviet Union | 22.2 /100 | #192 | Fair 2.5% |
| Ukrainians | 21.4 /100 | #193 | Fair 2.5% |
| Immigrants | Germany | 17.9 /100 | #194 | Poor 2.5% |
| Immigrants | Southern Europe | 15.6 /100 | #195 | Poor 2.5% |
| Koreans | 15.5 /100 | #196 | Poor 2.5% |
| Crow | 15.2 /100 | #197 | Poor 2.5% |