Argentinean vs Cree Self-Care Disability
COMPARE
Argentinean
Cree
Self-Care Disability
Self-Care Disability Comparison
Argentineans
Cree
2.3%
SELF-CARE DISABILITY
99.6/ 100
METRIC RATING
54th/ 347
METRIC RANK
2.8%
SELF-CARE DISABILITY
0.0/ 100
METRIC RATING
304th/ 347
METRIC RANK
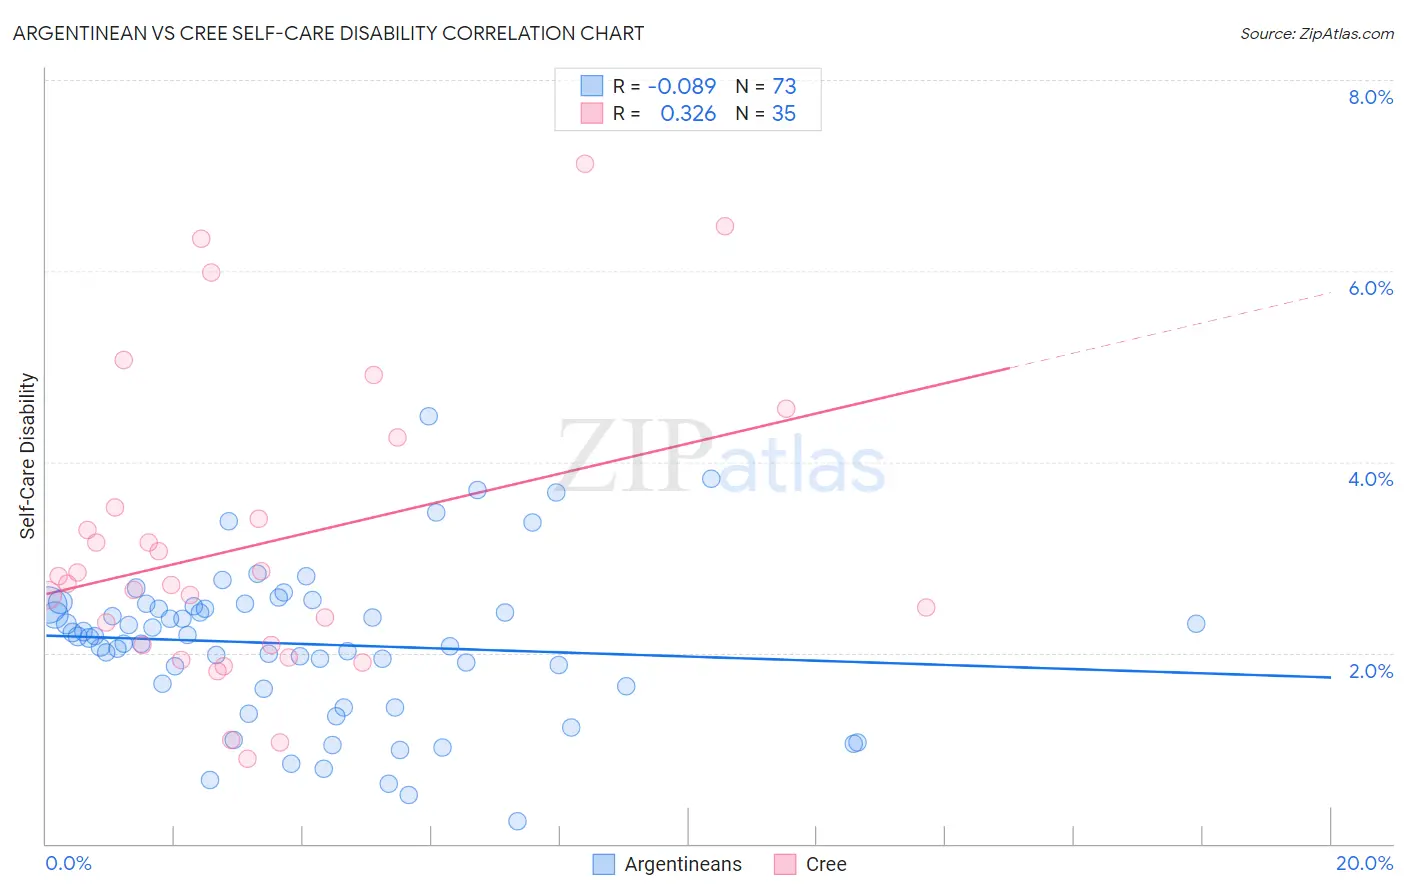
Argentinean vs Cree Self-Care Disability Correlation Chart
The statistical analysis conducted on geographies consisting of 296,904,932 people shows a slight negative correlation between the proportion of Argentineans and percentage of population with self-care disability in the United States with a correlation coefficient (R) of -0.089 and weighted average of 2.3%. Similarly, the statistical analysis conducted on geographies consisting of 76,186,163 people shows a mild positive correlation between the proportion of Cree and percentage of population with self-care disability in the United States with a correlation coefficient (R) of 0.326 and weighted average of 2.8%, a difference of 21.2%.
Self-Care Disability Correlation Summary
| Measurement | Argentinean | Cree |
| Minimum | 0.24% | 0.89% |
| Maximum | 4.5% | 7.1% |
| Range | 4.2% | 6.2% |
| Mean | 2.1% | 3.1% |
| Median | 2.2% | 2.7% |
| Interquartile 25% (IQ1) | 1.6% | 2.1% |
| Interquartile 75% (IQ3) | 2.5% | 3.5% |
| Interquartile Range (IQR) | 0.85% | 1.4% |
| Standard Deviation (Sample) | 0.81% | 1.6% |
| Standard Deviation (Population) | 0.80% | 1.5% |
Similar Demographics by Self-Care Disability
Demographics Similar to Argentineans by Self-Care Disability
In terms of self-care disability, the demographic groups most similar to Argentineans are Australian (2.3%, a difference of 0.050%), Immigrants from France (2.3%, a difference of 0.060%), Immigrants from Serbia (2.3%, a difference of 0.080%), Kenyan (2.3%, a difference of 0.10%), and Immigrants from Eastern Asia (2.3%, a difference of 0.10%).
| Demographics | Rating | Rank | Self-Care Disability |
| Jordanians | 99.7 /100 | #47 | Exceptional 2.3% |
| Immigrants | Malaysia | 99.7 /100 | #48 | Exceptional 2.3% |
| Latvians | 99.7 /100 | #49 | Exceptional 2.3% |
| Immigrants | Brazil | 99.7 /100 | #50 | Exceptional 2.3% |
| Kenyans | 99.7 /100 | #51 | Exceptional 2.3% |
| Immigrants | Serbia | 99.6 /100 | #52 | Exceptional 2.3% |
| Australians | 99.6 /100 | #53 | Exceptional 2.3% |
| Argentineans | 99.6 /100 | #54 | Exceptional 2.3% |
| Immigrants | France | 99.6 /100 | #55 | Exceptional 2.3% |
| Immigrants | Eastern Asia | 99.6 /100 | #56 | Exceptional 2.3% |
| Immigrants | Belgium | 99.6 /100 | #57 | Exceptional 2.3% |
| Immigrants | Cameroon | 99.6 /100 | #58 | Exceptional 2.3% |
| New Zealanders | 99.5 /100 | #59 | Exceptional 2.3% |
| Immigrants | Japan | 99.5 /100 | #60 | Exceptional 2.3% |
| Palestinians | 99.4 /100 | #61 | Exceptional 2.3% |
Demographics Similar to Cree by Self-Care Disability
In terms of self-care disability, the demographic groups most similar to Cree are Immigrants from West Indies (2.8%, a difference of 0.050%), Immigrants from Belize (2.8%, a difference of 0.16%), Immigrants from St. Vincent and the Grenadines (2.8%, a difference of 0.30%), Pima (2.8%, a difference of 0.34%), and Immigrants from Fiji (2.8%, a difference of 0.43%).
| Demographics | Rating | Rank | Self-Care Disability |
| West Indians | 0.0 /100 | #297 | Tragic 2.8% |
| Americans | 0.0 /100 | #298 | Tragic 2.8% |
| Immigrants | Guyana | 0.0 /100 | #299 | Tragic 2.8% |
| Immigrants | Fiji | 0.0 /100 | #300 | Tragic 2.8% |
| Pima | 0.0 /100 | #301 | Tragic 2.8% |
| Immigrants | St. Vincent and the Grenadines | 0.0 /100 | #302 | Tragic 2.8% |
| Immigrants | Belize | 0.0 /100 | #303 | Tragic 2.8% |
| Cree | 0.0 /100 | #304 | Tragic 2.8% |
| Immigrants | West Indies | 0.0 /100 | #305 | Tragic 2.8% |
| Aleuts | 0.0 /100 | #306 | Tragic 2.8% |
| Natives/Alaskans | 0.0 /100 | #307 | Tragic 2.8% |
| Immigrants | Grenada | 0.0 /100 | #308 | Tragic 2.8% |
| Bangladeshis | 0.0 /100 | #309 | Tragic 2.8% |
| British West Indians | 0.0 /100 | #310 | Tragic 2.8% |
| Puget Sound Salish | 0.0 /100 | #311 | Tragic 2.8% |