Immigrants from Sweden vs Immigrants from Switzerland Disability Age 5 to 17
COMPARE
Immigrants from Sweden
Immigrants from Switzerland
Disability Age 5 to 17
Disability Age 5 to 17 Comparison
Immigrants from Sweden
Immigrants from Switzerland
5.2%
DISABILITY AGE 5 TO 17
99.5/ 100
METRIC RATING
82nd/ 347
METRIC RANK
5.2%
DISABILITY AGE 5 TO 17
99.8/ 100
METRIC RATING
61st/ 347
METRIC RANK
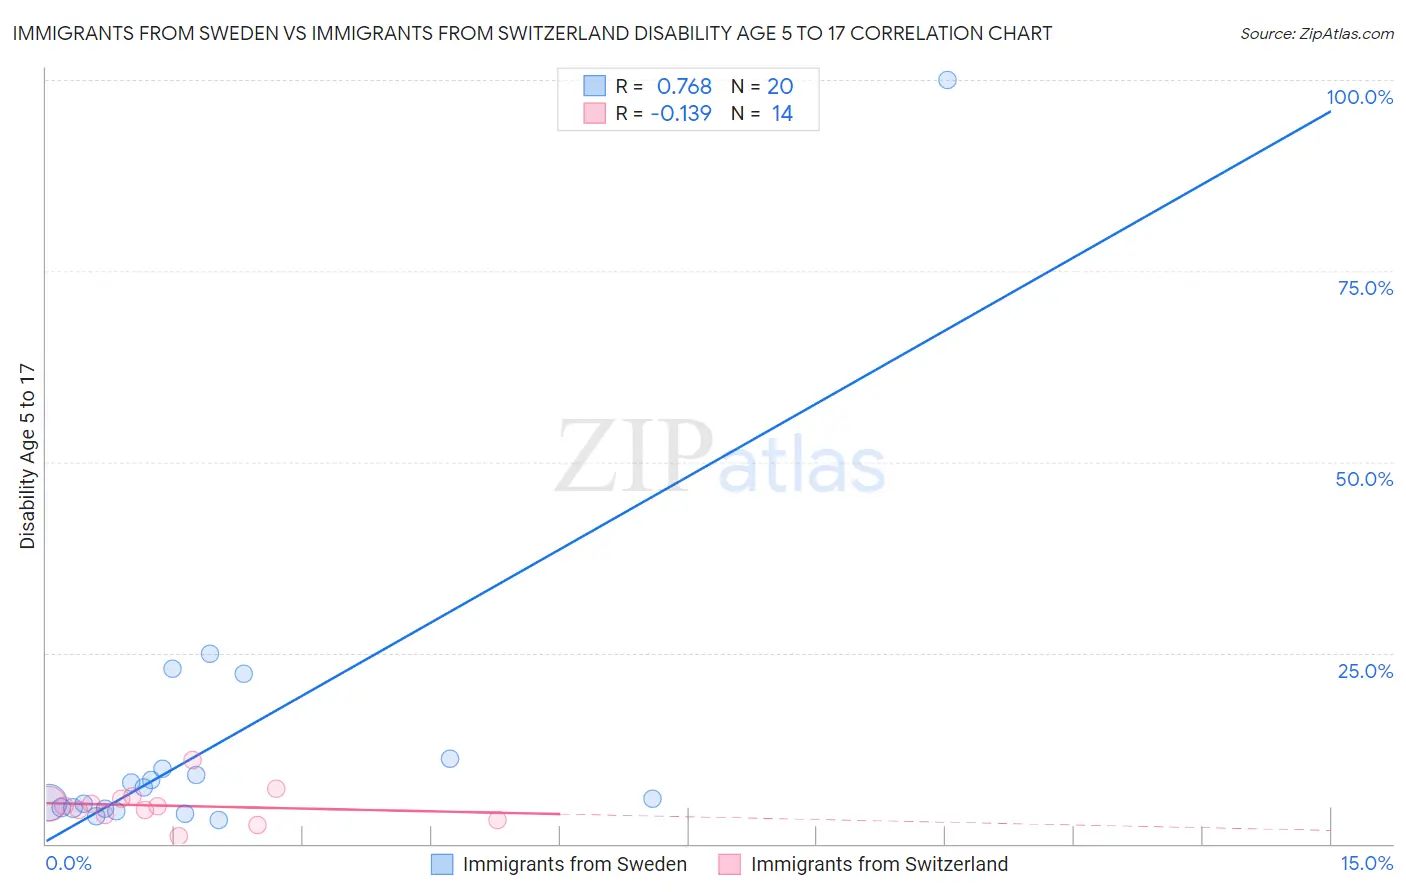
Immigrants from Sweden vs Immigrants from Switzerland Disability Age 5 to 17 Correlation Chart
The statistical analysis conducted on geographies consisting of 163,789,898 people shows a strong positive correlation between the proportion of Immigrants from Sweden and percentage of population with a disability between the ages 5 and 17 in the United States with a correlation coefficient (R) of 0.768 and weighted average of 5.2%. Similarly, the statistical analysis conducted on geographies consisting of 147,257,747 people shows a poor negative correlation between the proportion of Immigrants from Switzerland and percentage of population with a disability between the ages 5 and 17 in the United States with a correlation coefficient (R) of -0.139 and weighted average of 5.2%, a difference of 1.3%.
Disability Age 5 to 17 Correlation Summary
| Measurement | Immigrants from Sweden | Immigrants from Switzerland |
| Minimum | 3.1% | 0.94% |
| Maximum | 100.0% | 10.9% |
| Range | 96.9% | 10.0% |
| Mean | 13.5% | 5.0% |
| Median | 6.6% | 5.0% |
| Interquartile 25% (IQ1) | 4.7% | 3.8% |
| Interquartile 75% (IQ3) | 10.4% | 5.9% |
| Interquartile Range (IQR) | 5.8% | 2.2% |
| Standard Deviation (Sample) | 21.4% | 2.3% |
| Standard Deviation (Population) | 20.9% | 2.2% |
Similar Demographics by Disability Age 5 to 17
Demographics Similar to Immigrants from Sweden by Disability Age 5 to 17
In terms of disability age 5 to 17, the demographic groups most similar to Immigrants from Sweden are Immigrants from France (5.2%, a difference of 0.090%), Native Hawaiian (5.2%, a difference of 0.11%), Sri Lankan (5.2%, a difference of 0.15%), Immigrants from Nicaragua (5.2%, a difference of 0.16%), and Afghan (5.2%, a difference of 0.17%).
| Demographics | Rating | Rank | Disability Age 5 to 17 |
| Immigrants | Moldova | 99.6 /100 | #75 | Exceptional 5.2% |
| Immigrants | Guyana | 99.6 /100 | #76 | Exceptional 5.2% |
| Immigrants | Kazakhstan | 99.6 /100 | #77 | Exceptional 5.2% |
| Immigrants | Cuba | 99.6 /100 | #78 | Exceptional 5.2% |
| Afghans | 99.6 /100 | #79 | Exceptional 5.2% |
| Sri Lankans | 99.6 /100 | #80 | Exceptional 5.2% |
| Native Hawaiians | 99.6 /100 | #81 | Exceptional 5.2% |
| Immigrants | Sweden | 99.5 /100 | #82 | Exceptional 5.2% |
| Immigrants | France | 99.5 /100 | #83 | Exceptional 5.2% |
| Immigrants | Nicaragua | 99.5 /100 | #84 | Exceptional 5.2% |
| Bulgarians | 99.4 /100 | #85 | Exceptional 5.2% |
| Immigrants | St. Vincent and the Grenadines | 99.4 /100 | #86 | Exceptional 5.2% |
| Eastern Europeans | 99.4 /100 | #87 | Exceptional 5.2% |
| Immigrants | Croatia | 99.4 /100 | #88 | Exceptional 5.2% |
| Immigrants | Spain | 99.4 /100 | #89 | Exceptional 5.2% |
Demographics Similar to Immigrants from Switzerland by Disability Age 5 to 17
In terms of disability age 5 to 17, the demographic groups most similar to Immigrants from Switzerland are Immigrants from Ireland (5.2%, a difference of 0.090%), Immigrants from Bangladesh (5.2%, a difference of 0.20%), Immigrants from South Eastern Asia (5.2%, a difference of 0.23%), Immigrants from Greece (5.2%, a difference of 0.24%), and Palestinian (5.2%, a difference of 0.28%).
| Demographics | Rating | Rank | Disability Age 5 to 17 |
| Paraguayans | 99.9 /100 | #54 | Exceptional 5.1% |
| Laotians | 99.9 /100 | #55 | Exceptional 5.1% |
| Immigrants | Turkey | 99.9 /100 | #56 | Exceptional 5.1% |
| Immigrants | Poland | 99.9 /100 | #57 | Exceptional 5.1% |
| Immigrants | Ukraine | 99.9 /100 | #58 | Exceptional 5.1% |
| Immigrants | North Macedonia | 99.9 /100 | #59 | Exceptional 5.1% |
| Immigrants | Eastern Europe | 99.9 /100 | #60 | Exceptional 5.1% |
| Immigrants | Switzerland | 99.8 /100 | #61 | Exceptional 5.2% |
| Immigrants | Ireland | 99.8 /100 | #62 | Exceptional 5.2% |
| Immigrants | Bangladesh | 99.8 /100 | #63 | Exceptional 5.2% |
| Immigrants | South Eastern Asia | 99.8 /100 | #64 | Exceptional 5.2% |
| Immigrants | Greece | 99.8 /100 | #65 | Exceptional 5.2% |
| Palestinians | 99.8 /100 | #66 | Exceptional 5.2% |
| Macedonians | 99.8 /100 | #67 | Exceptional 5.2% |
| Immigrants | Syria | 99.7 /100 | #68 | Exceptional 5.2% |