Immigrants from Pakistan vs Immigrants from Switzerland Disability Age 5 to 17
COMPARE
Immigrants from Pakistan
Immigrants from Switzerland
Disability Age 5 to 17
Disability Age 5 to 17 Comparison
Immigrants from Pakistan
Immigrants from Switzerland
5.0%
DISABILITY AGE 5 TO 17
100.0/ 100
METRIC RATING
31st/ 347
METRIC RANK
5.2%
DISABILITY AGE 5 TO 17
99.8/ 100
METRIC RATING
61st/ 347
METRIC RANK
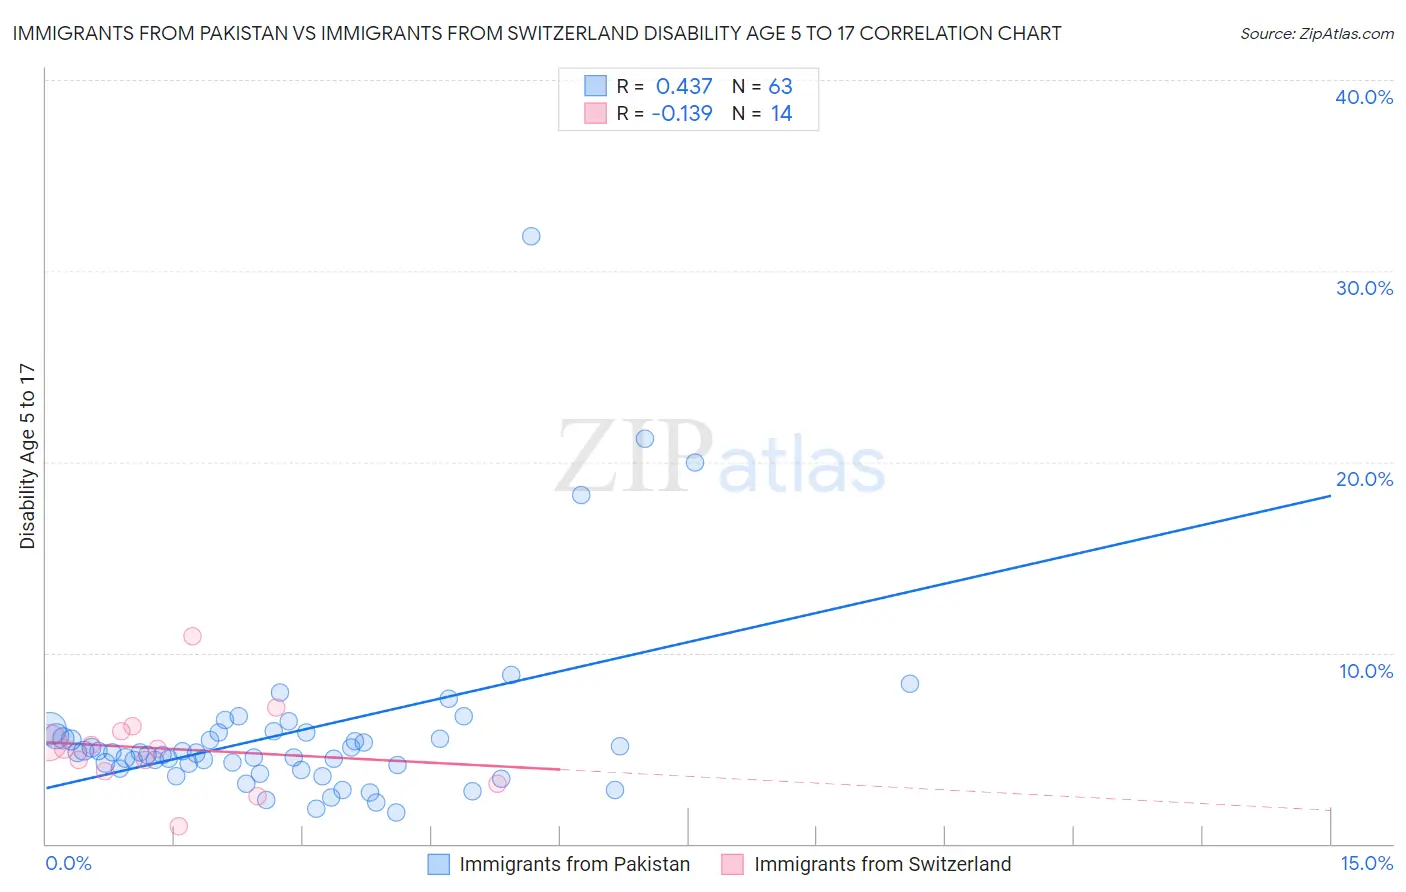
Immigrants from Pakistan vs Immigrants from Switzerland Disability Age 5 to 17 Correlation Chart
The statistical analysis conducted on geographies consisting of 282,773,176 people shows a moderate positive correlation between the proportion of Immigrants from Pakistan and percentage of population with a disability between the ages 5 and 17 in the United States with a correlation coefficient (R) of 0.437 and weighted average of 5.0%. Similarly, the statistical analysis conducted on geographies consisting of 147,257,747 people shows a poor negative correlation between the proportion of Immigrants from Switzerland and percentage of population with a disability between the ages 5 and 17 in the United States with a correlation coefficient (R) of -0.139 and weighted average of 5.2%, a difference of 3.9%.
Disability Age 5 to 17 Correlation Summary
| Measurement | Immigrants from Pakistan | Immigrants from Switzerland |
| Minimum | 1.7% | 0.94% |
| Maximum | 31.8% | 10.9% |
| Range | 30.2% | 10.0% |
| Mean | 5.9% | 5.0% |
| Median | 4.8% | 5.0% |
| Interquartile 25% (IQ1) | 3.9% | 3.8% |
| Interquartile 75% (IQ3) | 5.8% | 5.9% |
| Interquartile Range (IQR) | 1.9% | 2.2% |
| Standard Deviation (Sample) | 4.9% | 2.3% |
| Standard Deviation (Population) | 4.8% | 2.2% |
Similar Demographics by Disability Age 5 to 17
Demographics Similar to Immigrants from Pakistan by Disability Age 5 to 17
In terms of disability age 5 to 17, the demographic groups most similar to Immigrants from Pakistan are Soviet Union (5.0%, a difference of 0.040%), Immigrants from Malaysia (5.0%, a difference of 0.25%), Immigrants from Indonesia (5.0%, a difference of 0.36%), Immigrants from Serbia (4.9%, a difference of 0.47%), and Israeli (5.0%, a difference of 0.48%).
| Demographics | Rating | Rank | Disability Age 5 to 17 |
| Immigrants | Lebanon | 100.0 /100 | #24 | Exceptional 4.8% |
| Immigrants | Asia | 100.0 /100 | #25 | Exceptional 4.8% |
| Bhutanese | 100.0 /100 | #26 | Exceptional 4.9% |
| Taiwanese | 100.0 /100 | #27 | Exceptional 4.9% |
| Immigrants | Japan | 100.0 /100 | #28 | Exceptional 4.9% |
| Immigrants | Serbia | 100.0 /100 | #29 | Exceptional 4.9% |
| Immigrants | Malaysia | 100.0 /100 | #30 | Exceptional 5.0% |
| Immigrants | Pakistan | 100.0 /100 | #31 | Exceptional 5.0% |
| Soviet Union | 100.0 /100 | #32 | Exceptional 5.0% |
| Immigrants | Indonesia | 100.0 /100 | #33 | Exceptional 5.0% |
| Israelis | 100.0 /100 | #34 | Exceptional 5.0% |
| Bolivians | 100.0 /100 | #35 | Exceptional 5.0% |
| Immigrants | Egypt | 100.0 /100 | #36 | Exceptional 5.0% |
| Immigrants | Belarus | 100.0 /100 | #37 | Exceptional 5.0% |
| Immigrants | Philippines | 100.0 /100 | #38 | Exceptional 5.0% |
Demographics Similar to Immigrants from Switzerland by Disability Age 5 to 17
In terms of disability age 5 to 17, the demographic groups most similar to Immigrants from Switzerland are Immigrants from Ireland (5.2%, a difference of 0.090%), Immigrants from Bangladesh (5.2%, a difference of 0.20%), Immigrants from South Eastern Asia (5.2%, a difference of 0.23%), Immigrants from Greece (5.2%, a difference of 0.24%), and Palestinian (5.2%, a difference of 0.28%).
| Demographics | Rating | Rank | Disability Age 5 to 17 |
| Paraguayans | 99.9 /100 | #54 | Exceptional 5.1% |
| Laotians | 99.9 /100 | #55 | Exceptional 5.1% |
| Immigrants | Turkey | 99.9 /100 | #56 | Exceptional 5.1% |
| Immigrants | Poland | 99.9 /100 | #57 | Exceptional 5.1% |
| Immigrants | Ukraine | 99.9 /100 | #58 | Exceptional 5.1% |
| Immigrants | North Macedonia | 99.9 /100 | #59 | Exceptional 5.1% |
| Immigrants | Eastern Europe | 99.9 /100 | #60 | Exceptional 5.1% |
| Immigrants | Switzerland | 99.8 /100 | #61 | Exceptional 5.2% |
| Immigrants | Ireland | 99.8 /100 | #62 | Exceptional 5.2% |
| Immigrants | Bangladesh | 99.8 /100 | #63 | Exceptional 5.2% |
| Immigrants | South Eastern Asia | 99.8 /100 | #64 | Exceptional 5.2% |
| Immigrants | Greece | 99.8 /100 | #65 | Exceptional 5.2% |
| Palestinians | 99.8 /100 | #66 | Exceptional 5.2% |
| Macedonians | 99.8 /100 | #67 | Exceptional 5.2% |
| Immigrants | Syria | 99.7 /100 | #68 | Exceptional 5.2% |