Immigrants from Sweden vs Austrian Disability Age 5 to 17
COMPARE
Immigrants from Sweden
Austrian
Disability Age 5 to 17
Disability Age 5 to 17 Comparison
Immigrants from Sweden
Austrians
5.2%
DISABILITY AGE 5 TO 17
99.5/ 100
METRIC RATING
82nd/ 347
METRIC RANK
5.7%
DISABILITY AGE 5 TO 17
13.2/ 100
METRIC RATING
202nd/ 347
METRIC RANK
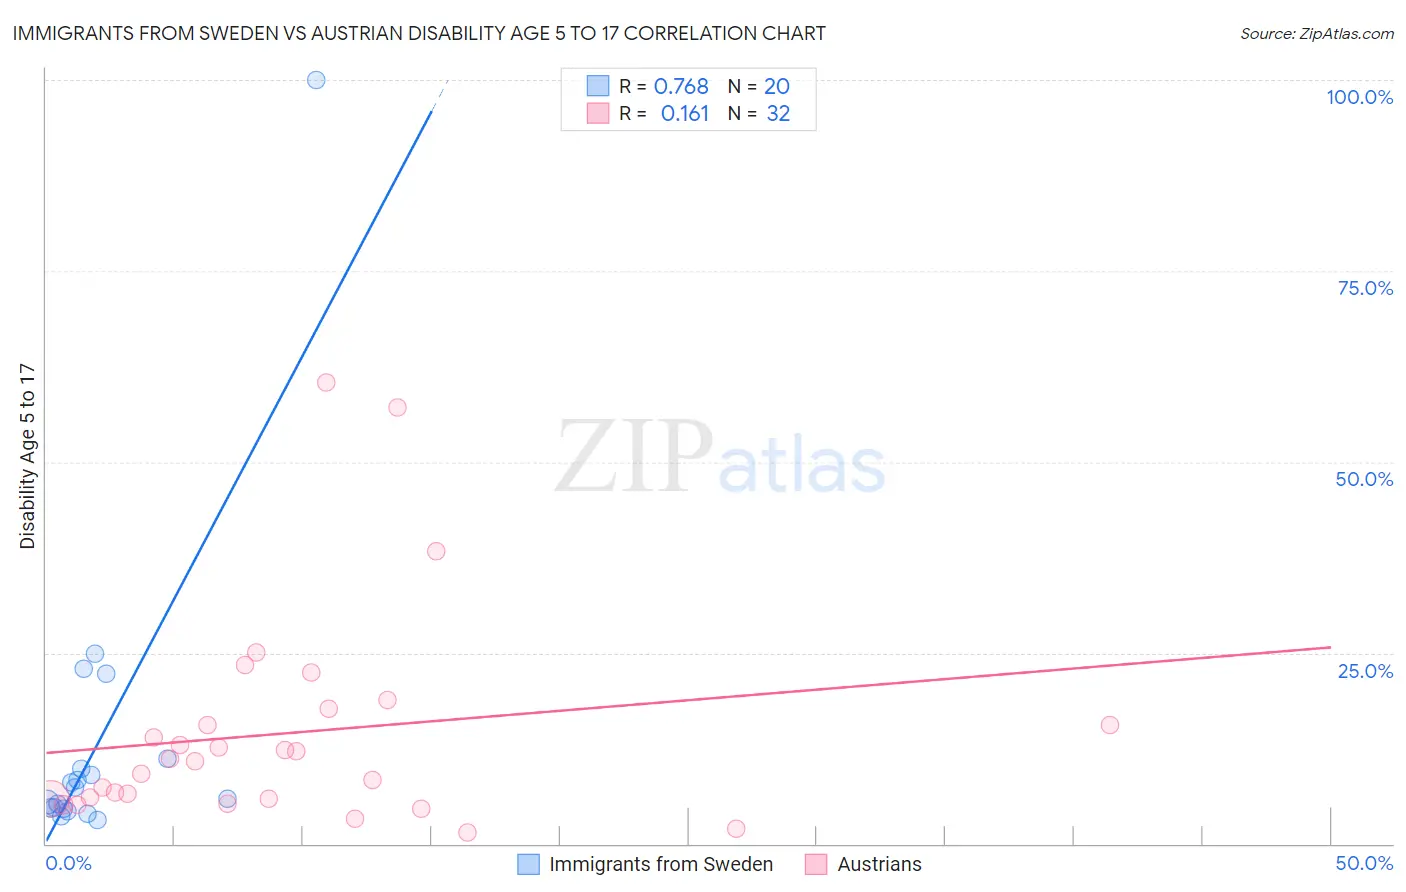
Immigrants from Sweden vs Austrian Disability Age 5 to 17 Correlation Chart
The statistical analysis conducted on geographies consisting of 163,789,898 people shows a strong positive correlation between the proportion of Immigrants from Sweden and percentage of population with a disability between the ages 5 and 17 in the United States with a correlation coefficient (R) of 0.768 and weighted average of 5.2%. Similarly, the statistical analysis conducted on geographies consisting of 446,287,500 people shows a poor positive correlation between the proportion of Austrians and percentage of population with a disability between the ages 5 and 17 in the United States with a correlation coefficient (R) of 0.161 and weighted average of 5.7%, a difference of 9.5%.
Disability Age 5 to 17 Correlation Summary
| Measurement | Immigrants from Sweden | Austrian |
| Minimum | 3.1% | 1.5% |
| Maximum | 100.0% | 60.4% |
| Range | 96.9% | 58.9% |
| Mean | 13.5% | 14.5% |
| Median | 6.6% | 10.9% |
| Interquartile 25% (IQ1) | 4.7% | 5.9% |
| Interquartile 75% (IQ3) | 10.4% | 16.6% |
| Interquartile Range (IQR) | 5.8% | 10.8% |
| Standard Deviation (Sample) | 21.4% | 14.0% |
| Standard Deviation (Population) | 20.9% | 13.8% |
Similar Demographics by Disability Age 5 to 17
Demographics Similar to Immigrants from Sweden by Disability Age 5 to 17
In terms of disability age 5 to 17, the demographic groups most similar to Immigrants from Sweden are Immigrants from France (5.2%, a difference of 0.090%), Native Hawaiian (5.2%, a difference of 0.11%), Sri Lankan (5.2%, a difference of 0.15%), Immigrants from Nicaragua (5.2%, a difference of 0.16%), and Afghan (5.2%, a difference of 0.17%).
| Demographics | Rating | Rank | Disability Age 5 to 17 |
| Immigrants | Moldova | 99.6 /100 | #75 | Exceptional 5.2% |
| Immigrants | Guyana | 99.6 /100 | #76 | Exceptional 5.2% |
| Immigrants | Kazakhstan | 99.6 /100 | #77 | Exceptional 5.2% |
| Immigrants | Cuba | 99.6 /100 | #78 | Exceptional 5.2% |
| Afghans | 99.6 /100 | #79 | Exceptional 5.2% |
| Sri Lankans | 99.6 /100 | #80 | Exceptional 5.2% |
| Native Hawaiians | 99.6 /100 | #81 | Exceptional 5.2% |
| Immigrants | Sweden | 99.5 /100 | #82 | Exceptional 5.2% |
| Immigrants | France | 99.5 /100 | #83 | Exceptional 5.2% |
| Immigrants | Nicaragua | 99.5 /100 | #84 | Exceptional 5.2% |
| Bulgarians | 99.4 /100 | #85 | Exceptional 5.2% |
| Immigrants | St. Vincent and the Grenadines | 99.4 /100 | #86 | Exceptional 5.2% |
| Eastern Europeans | 99.4 /100 | #87 | Exceptional 5.2% |
| Immigrants | Croatia | 99.4 /100 | #88 | Exceptional 5.2% |
| Immigrants | Spain | 99.4 /100 | #89 | Exceptional 5.2% |
Demographics Similar to Austrians by Disability Age 5 to 17
In terms of disability age 5 to 17, the demographic groups most similar to Austrians are Spanish American Indian (5.7%, a difference of 0.040%), Basque (5.7%, a difference of 0.050%), Icelander (5.7%, a difference of 0.14%), Northern European (5.7%, a difference of 0.20%), and Paiute (5.7%, a difference of 0.22%).
| Demographics | Rating | Rank | Disability Age 5 to 17 |
| Immigrants | Nigeria | 23.4 /100 | #195 | Fair 5.7% |
| Inupiat | 23.3 /100 | #196 | Fair 5.7% |
| Immigrants | North America | 23.1 /100 | #197 | Fair 5.7% |
| Norwegians | 20.9 /100 | #198 | Fair 5.7% |
| Northern Europeans | 15.2 /100 | #199 | Poor 5.7% |
| Icelanders | 14.6 /100 | #200 | Poor 5.7% |
| Basques | 13.7 /100 | #201 | Poor 5.7% |
| Austrians | 13.2 /100 | #202 | Poor 5.7% |
| Spanish American Indians | 12.8 /100 | #203 | Poor 5.7% |
| Paiute | 11.2 /100 | #204 | Poor 5.7% |
| Trinidadians and Tobagonians | 10.8 /100 | #205 | Poor 5.7% |
| Immigrants | Africa | 10.8 /100 | #206 | Poor 5.7% |
| Moroccans | 10.4 /100 | #207 | Poor 5.7% |
| Kenyans | 10.0 /100 | #208 | Poor 5.8% |
| Immigrants | Uganda | 9.7 /100 | #209 | Tragic 5.8% |