Immigrants from Sri Lanka vs Immigrants from Africa Disability Age Under 5
COMPARE
Immigrants from Sri Lanka
Immigrants from Africa
Disability Age Under 5
Disability Age Under 5 Comparison
Immigrants from Sri Lanka
Immigrants from Africa
1.1%
DISABILITY AGE UNDER 5
98.5/ 100
METRIC RATING
73rd/ 347
METRIC RANK
1.2%
DISABILITY AGE UNDER 5
65.1/ 100
METRIC RATING
161st/ 347
METRIC RANK
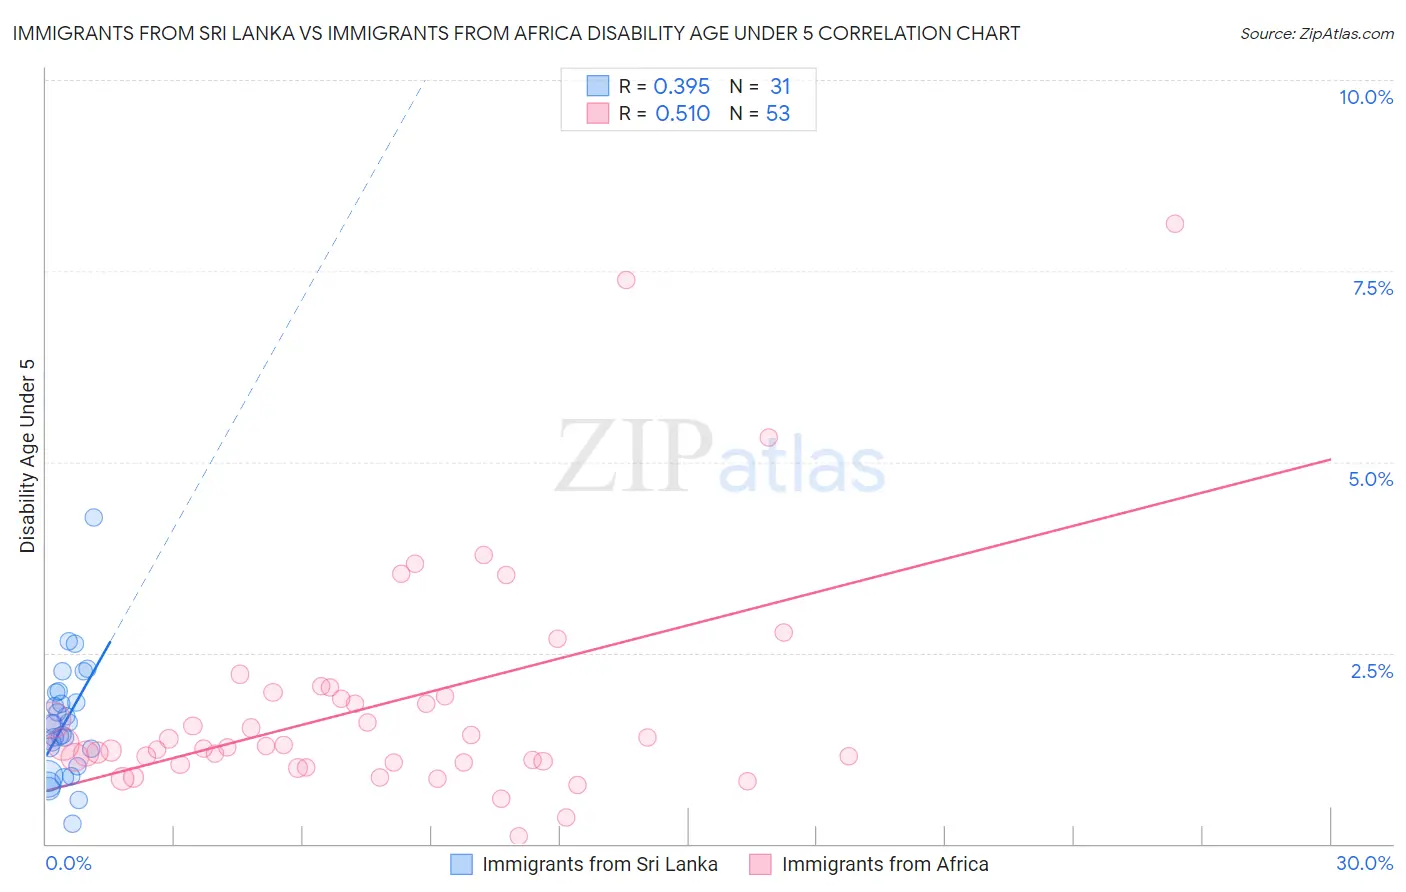
Immigrants from Sri Lanka vs Immigrants from Africa Disability Age Under 5 Correlation Chart
The statistical analysis conducted on geographies consisting of 104,720,204 people shows a mild positive correlation between the proportion of Immigrants from Sri Lanka and percentage of population with a disability under the age of 5 in the United States with a correlation coefficient (R) of 0.395 and weighted average of 1.1%. Similarly, the statistical analysis conducted on geographies consisting of 240,976,621 people shows a substantial positive correlation between the proportion of Immigrants from Africa and percentage of population with a disability under the age of 5 in the United States with a correlation coefficient (R) of 0.510 and weighted average of 1.2%, a difference of 8.8%.
Disability Age Under 5 Correlation Summary
| Measurement | Immigrants from Sri Lanka | Immigrants from Africa |
| Minimum | 0.25% | 0.10% |
| Maximum | 4.3% | 8.1% |
| Range | 4.0% | 8.0% |
| Mean | 1.6% | 1.8% |
| Median | 1.6% | 1.3% |
| Interquartile 25% (IQ1) | 1.0% | 1.1% |
| Interquartile 75% (IQ3) | 2.0% | 2.0% |
| Interquartile Range (IQR) | 0.97% | 0.89% |
| Standard Deviation (Sample) | 0.77% | 1.5% |
| Standard Deviation (Population) | 0.76% | 1.5% |
Similar Demographics by Disability Age Under 5
Demographics Similar to Immigrants from Sri Lanka by Disability Age Under 5
In terms of disability age under 5, the demographic groups most similar to Immigrants from Sri Lanka are Jordanian (1.1%, a difference of 0.0%), Burmese (1.1%, a difference of 0.080%), Immigrants from Pakistan (1.1%, a difference of 0.090%), Trinidadian and Tobagonian (1.1%, a difference of 0.24%), and Immigrants from Ecuador (1.1%, a difference of 0.30%).
| Demographics | Rating | Rank | Disability Age Under 5 |
| Immigrants | Indonesia | 98.7 /100 | #66 | Exceptional 1.1% |
| Immigrants | Belize | 98.7 /100 | #67 | Exceptional 1.1% |
| South Africans | 98.7 /100 | #68 | Exceptional 1.1% |
| Israelis | 98.7 /100 | #69 | Exceptional 1.1% |
| Immigrants | Ecuador | 98.6 /100 | #70 | Exceptional 1.1% |
| Trinidadians and Tobagonians | 98.6 /100 | #71 | Exceptional 1.1% |
| Burmese | 98.5 /100 | #72 | Exceptional 1.1% |
| Immigrants | Sri Lanka | 98.5 /100 | #73 | Exceptional 1.1% |
| Jordanians | 98.5 /100 | #74 | Exceptional 1.1% |
| Immigrants | Pakistan | 98.4 /100 | #75 | Exceptional 1.1% |
| Immigrants | Burma/Myanmar | 98.2 /100 | #76 | Exceptional 1.1% |
| Immigrants | Denmark | 98.1 /100 | #77 | Exceptional 1.1% |
| West Indians | 98.0 /100 | #78 | Exceptional 1.1% |
| Hmong | 98.0 /100 | #79 | Exceptional 1.1% |
| Immigrants | Trinidad and Tobago | 98.0 /100 | #80 | Exceptional 1.1% |
Demographics Similar to Immigrants from Africa by Disability Age Under 5
In terms of disability age under 5, the demographic groups most similar to Immigrants from Africa are Colombian (1.2%, a difference of 0.070%), Immigrants from Latin America (1.2%, a difference of 0.070%), Arab (1.2%, a difference of 0.13%), Guatemalan (1.2%, a difference of 0.15%), and Immigrants from South America (1.2%, a difference of 0.19%).
| Demographics | Rating | Rank | Disability Age Under 5 |
| Uruguayans | 68.8 /100 | #154 | Good 1.2% |
| Immigrants | Ghana | 68.7 /100 | #155 | Good 1.2% |
| Hawaiians | 68.5 /100 | #156 | Good 1.2% |
| Immigrants | South America | 67.0 /100 | #157 | Good 1.2% |
| Arabs | 66.4 /100 | #158 | Good 1.2% |
| Colombians | 65.8 /100 | #159 | Good 1.2% |
| Immigrants | Latin America | 65.8 /100 | #160 | Good 1.2% |
| Immigrants | Africa | 65.1 /100 | #161 | Good 1.2% |
| Guatemalans | 63.6 /100 | #162 | Good 1.2% |
| Immigrants | Guatemala | 63.2 /100 | #163 | Good 1.2% |
| Laotians | 62.8 /100 | #164 | Good 1.2% |
| Immigrants | Kuwait | 62.6 /100 | #165 | Good 1.2% |
| Immigrants | Central America | 61.4 /100 | #166 | Good 1.2% |
| Immigrants | Argentina | 60.2 /100 | #167 | Good 1.2% |
| Sierra Leoneans | 59.1 /100 | #168 | Average 1.2% |